'Stock market trend' category
How to calculate and plot pivots on an Excel chart
If you study a stock chart you will discover that sometimes significant trend reversals happen when a stock chart […]
If you study a stock chart you will discover that sometimes significant trend reversals happen when a stock chart […]
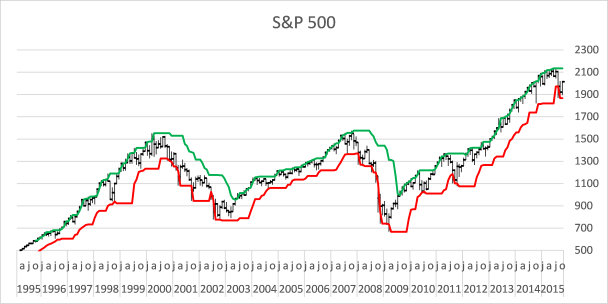
Follow stock market trends – trailing stop
This time I want to demonstrate an alternative way to identify a major trend in the stock market. The previous post […]
This time I want to demonstrate an alternative way to identify a major trend in the stock market. The previous post […]
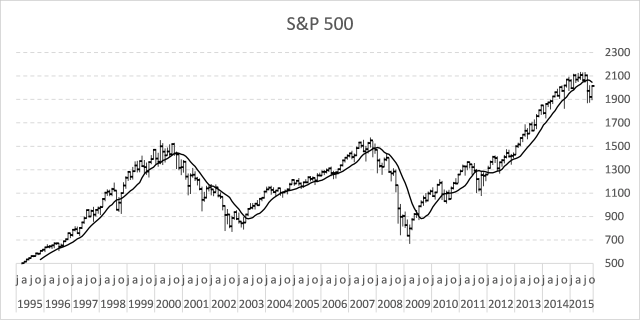
Follow stock market trends – Moving Average
In my previous post, I described how to build a dynamic stock chart that lets you easily adjust the date […]
In my previous post, I described how to build a dynamic stock chart that lets you easily adjust the date […]
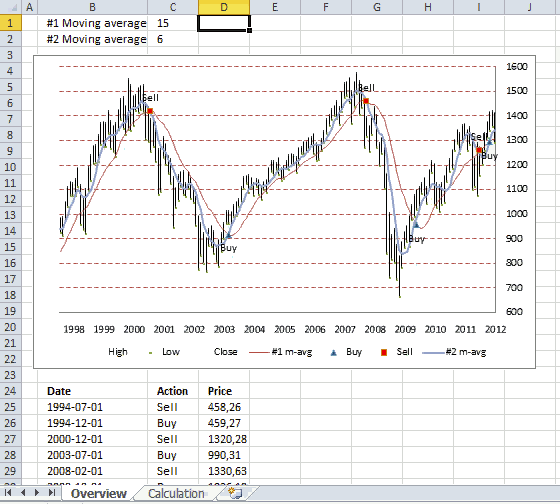
Plot buy and sell points in an Excel Chart based on two moving averages
This article demonstrates how to display buy and sell signals on an Excel chart based on two moving averages, the […]
This article demonstrates how to display buy and sell signals on an Excel chart based on two moving averages, the […]
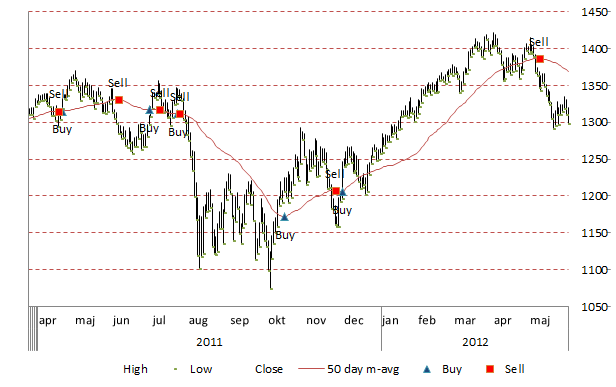
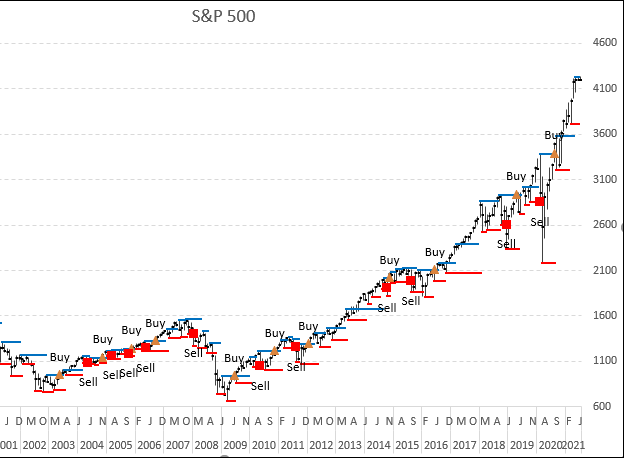
Add buy and sell points to a stock chart
The image above shows an Excel chart of the S&P 500 with buy and sell signals based on a 50 […]
The image above shows an Excel chart of the S&P 500 with buy and sell signals based on a 50 […]
Excel formula categories
AverageChooseCombine MergeCompareConcatenateConditional FormattingCountCount valuesDatesDuplicatesExtractFilterFilter recordsFiltered valuesFilterxmlHyperlinkIf cellIndex MatchLogicLookupsMatchMaxMinNumbers in sumOR logicOverlappingPartial matchRecordsSequenceSmallSort bySort valuesSumSumifsSumproductString manipulationTimeUnique distinct recordsUnique distinct valuesUnique recordsUnique valuesVlookupVlookup return values