'VBA' category
Subcategories
- Scroll bar (1)
- ARRAY function (1)
- Fix Function (1)
- INT function (1)
- JOIN function (1)
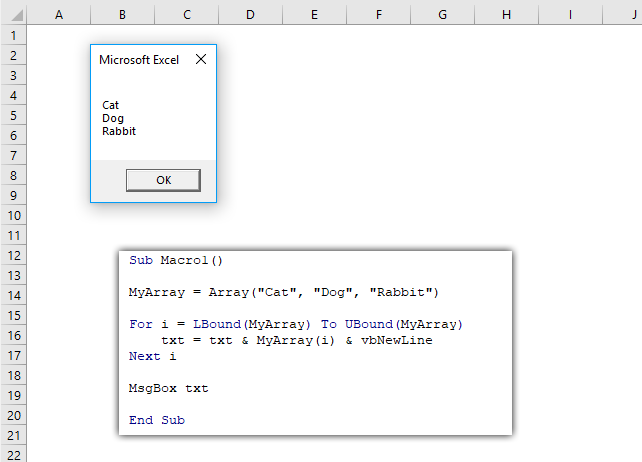
- Lbound Ubound function (1)
- SGN function (1)
- SPLIT function (1)
- Evaluate method (1)
- Range.Find method (1)
- TextToColumns method (1)
- DO LOOP statement (1)
- FOR NEXT statement (6)
- GoTo statement (1)
- IF THEN ELSE statement (6)
- SELECT CASE statement (1)
- SET statement (1)
- WITH … END WITH Statement (4)
Excel VBA functions
Table of Contents Functions How to use the ARRAY function How to use the FIX function How to use the […]
Table of Contents Functions How to use the ARRAY function How to use the FIX function How to use the […]
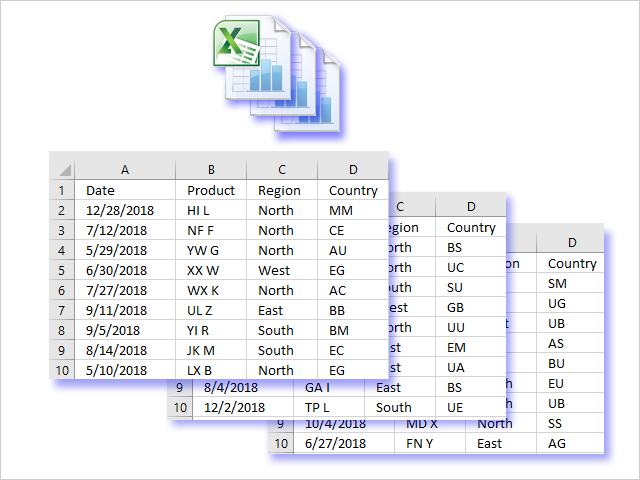
Copy data from workbooks in folder and subfolders
Working with multiple Excel workbooks can be time-consuming, especially when dealing with large datasets spread across multiple files. Fortunately, VBA […]
Working with multiple Excel workbooks can be time-consuming, especially when dealing with large datasets spread across multiple files. Fortunately, VBA […]
How to copy non contiguous cell ranges
Table of Contents Introduction How to copy non contiguous cell ranges Copy non-contiguous cell ranges - Macro How to copy […]
Table of Contents Introduction How to copy non contiguous cell ranges Copy non-contiguous cell ranges - Macro How to copy […]
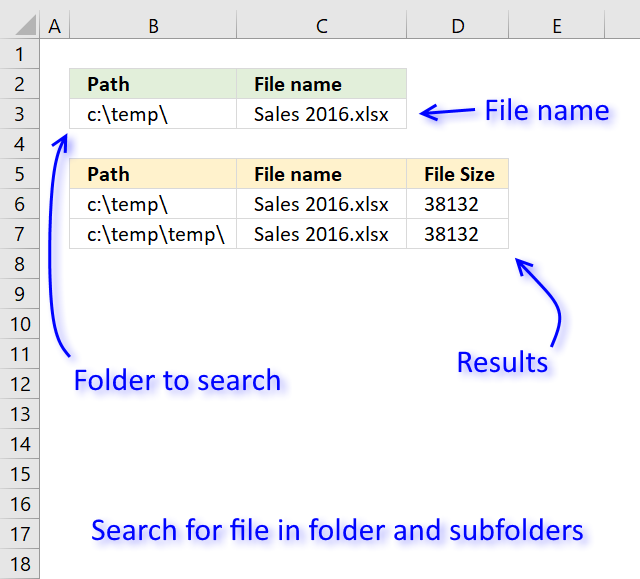
Search for a file in folder and subfolders – UDF
Table of Contents Search for a file in folder and sub folders - User Defined Function Search for a file […]
Table of Contents Search for a file in folder and sub folders - User Defined Function Search for a file […]
Run a macro every time a workbook opens or closes
This article explains how to set up a workbook so a macro is run every time you open the workbook. […]
This article explains how to set up a workbook so a macro is run every time you open the workbook. […]
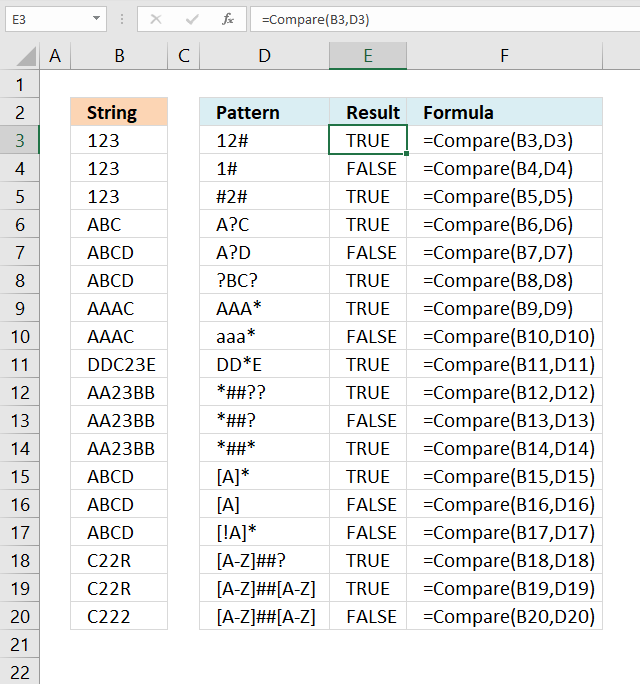
How to use the LIKE OPERATOR
The LIKE operator allows you to match a string to a pattern using Excel VBA. The image above demonstrates a […]
The LIKE operator allows you to match a string to a pattern using Excel VBA. The image above demonstrates a […]
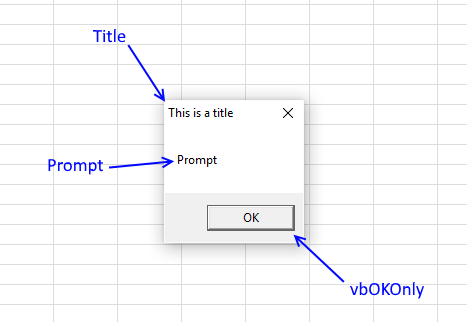
How to use DIALOG BOXES
A dialog box is an excellent alternative to a userform, they are built-in to VBA and can save you time […]
A dialog box is an excellent alternative to a userform, they are built-in to VBA and can save you time […]
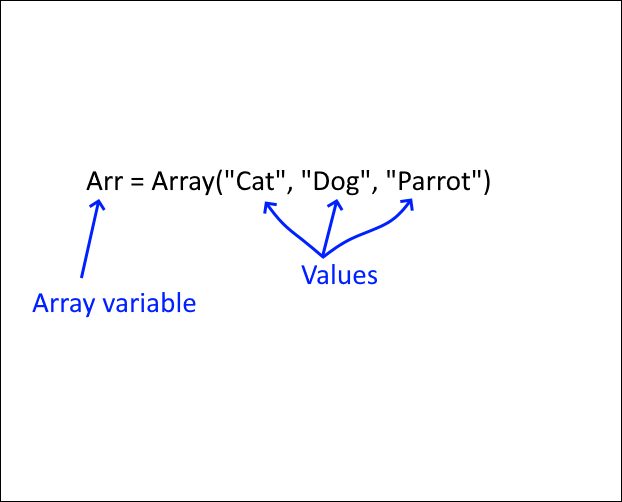
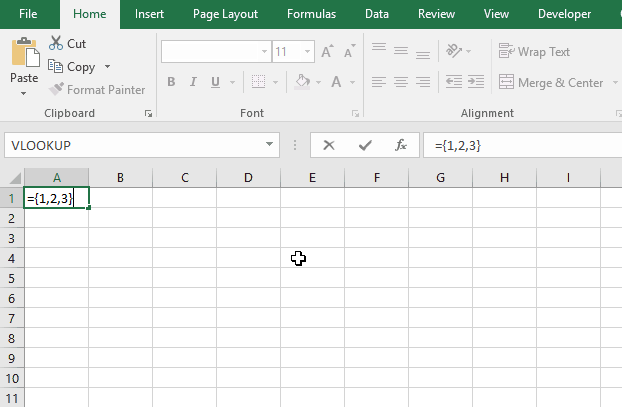
Working with ARRAY VARIABLES (VBA)
This post will teach you how to work with Excel arrays in visual basic for applications (VBA). Why do you […]
This post will teach you how to work with Excel arrays in visual basic for applications (VBA). Why do you […]
A beginners guide to Excel array formulas
Array formulas allows you to do advanced calculations not possible with regular formulas.
Array formulas allows you to do advanced calculations not possible with regular formulas.
Working with LIST BOXES (Form Controls)
This blog post shows you how to manipulate List Boxes (form controls) manually and with VBA code. Table of Contents […]
This blog post shows you how to manipulate List Boxes (form controls) manually and with VBA code. Table of Contents […]
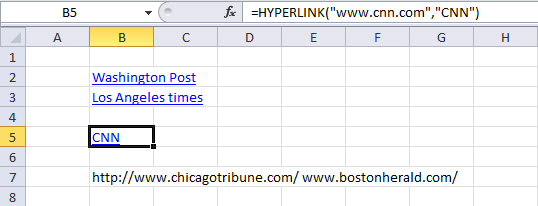
List all hyperlinks in worksheet programmatically
Table of Contents List all hyperlinks in worksheet programmatically Find cells containing formulas with literal (hardcoded) values Extract cell references […]
Table of Contents List all hyperlinks in worksheet programmatically Find cells containing formulas with literal (hardcoded) values Extract cell references […]
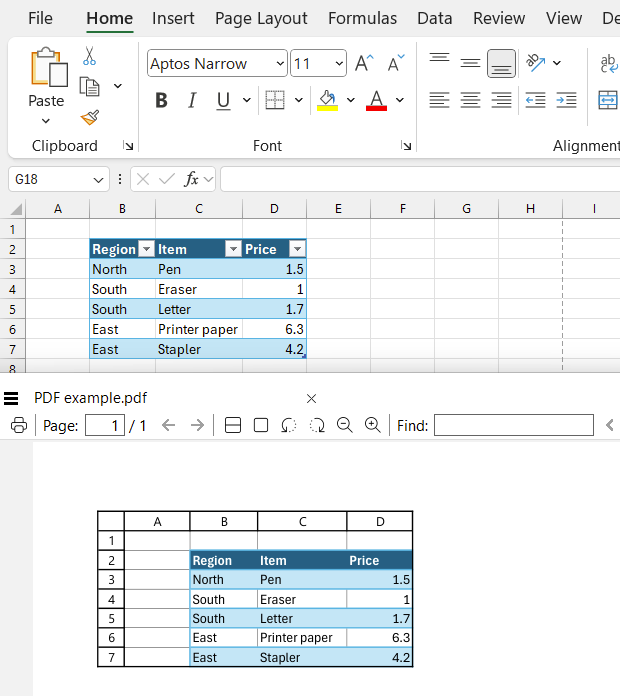
How to save specific multiple worksheets to a pdf file programmatically
This article demonstrates macros that export worksheets to a PDF file. What's on this webpage Introduction Export all worksheets in […]
This article demonstrates macros that export worksheets to a PDF file. What's on this webpage Introduction Export all worksheets in […]
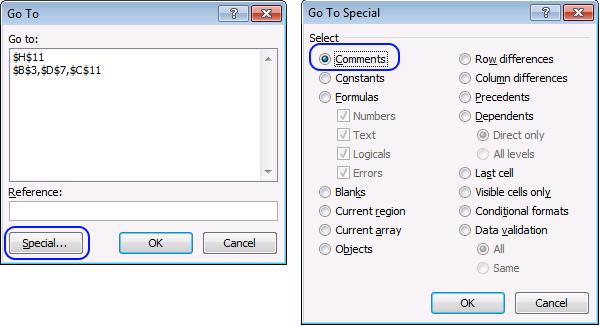
Working with comments – VBA
Did you know that you can select all cells containing comments in the current sheet? Press F5, press with left […]
Did you know that you can select all cells containing comments in the current sheet? Press F5, press with left […]
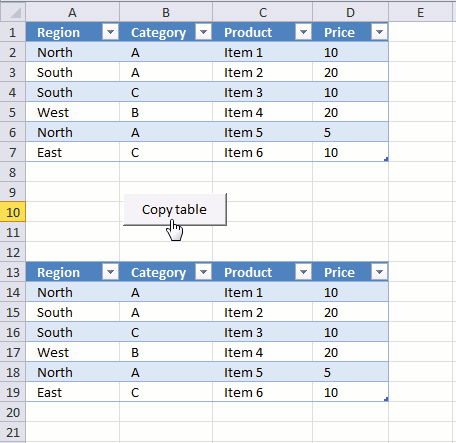
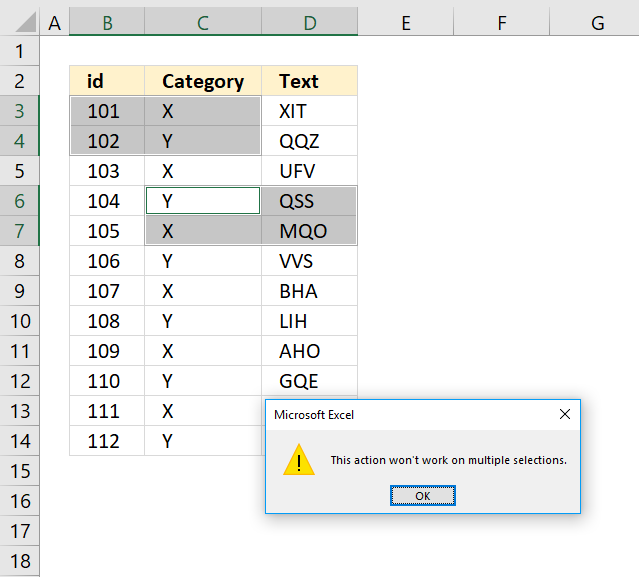
Working with Excel tables programmatically
The image above demonstrates a macro linked to a button. Press with left mouse button on the button and the […]
The image above demonstrates a macro linked to a button. Press with left mouse button on the button and the […]

Finding the shortest path – A * pathfinding
What's on this page Introduction Finding the shortest path - A * pathfinding Optimize pick path in a warehouse A […]
What's on this page Introduction Finding the shortest path - A * pathfinding Optimize pick path in a warehouse A […]
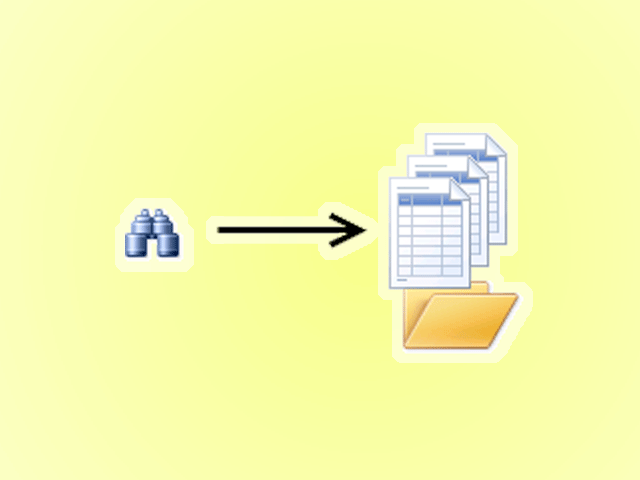
Search all workbooks in a folder
Today I'll show you how to search all Excel workbooks with file extensions xls, xlsx and xlsm in a given folder for a […]
Today I'll show you how to search all Excel workbooks with file extensions xls, xlsx and xlsm in a given folder for a […]
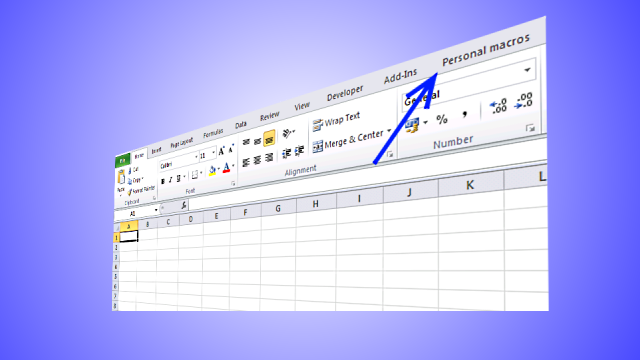
Customize the ribbon and how to add your macros
Save links to your favorite macros in a personal tab on the ribbon for easy access and to become more […]
Save links to your favorite macros in a personal tab on the ribbon for easy access and to become more […]
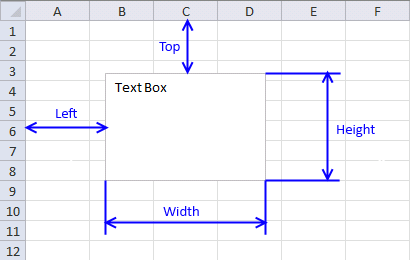
Working with TEXT BOXES [Form Controls]
What is a Text Box? A Text Box (Form Control) in Excel is an interactive element that allows users to […]
What is a Text Box? A Text Box (Form Control) in Excel is an interactive element that allows users to […]
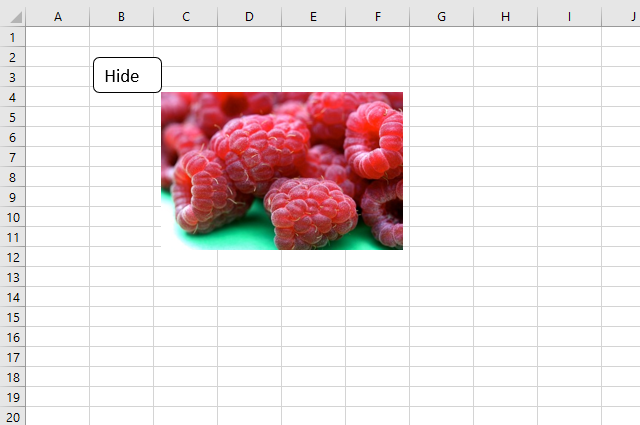
Show / hide a picture using a button
This article explains how to hide a specific image in Excel using a shape as a button. If the user […]
This article explains how to hide a specific image in Excel using a shape as a button. If the user […]
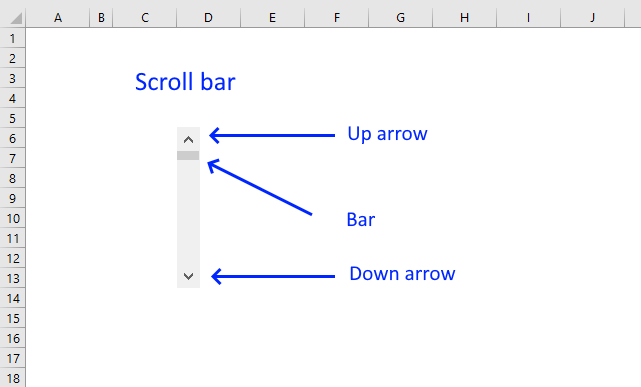
How to use the Scroll Bar
This article demonstrates how to insert and use a scroll bar (Form Control) in Excel. It allows the user to […]
This article demonstrates how to insert and use a scroll bar (Form Control) in Excel. It allows the user to […]
Working with FILES
Table of Contents Working with FILES Compare file names in two different folder locations and their sub folders Which Excel […]
Table of Contents Working with FILES Compare file names in two different folder locations and their sub folders Which Excel […]
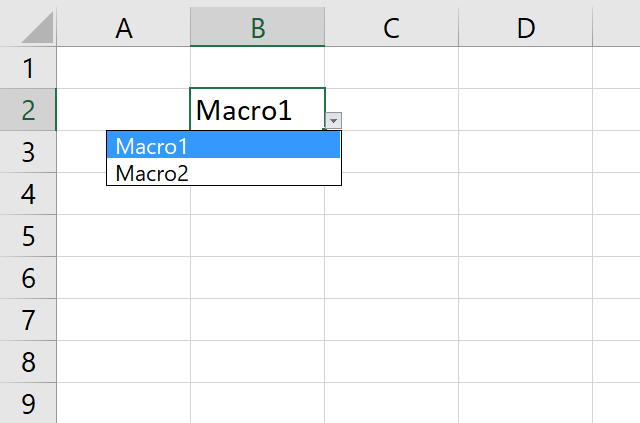
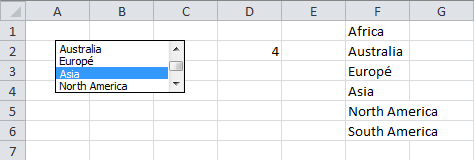
Run a Macro from a Drop Down list [VBA]
This article demonstrates how to run a VBA macro using a Drop Down list. The Drop Down list contains two […]
This article demonstrates how to run a VBA macro using a Drop Down list. The Drop Down list contains two […]
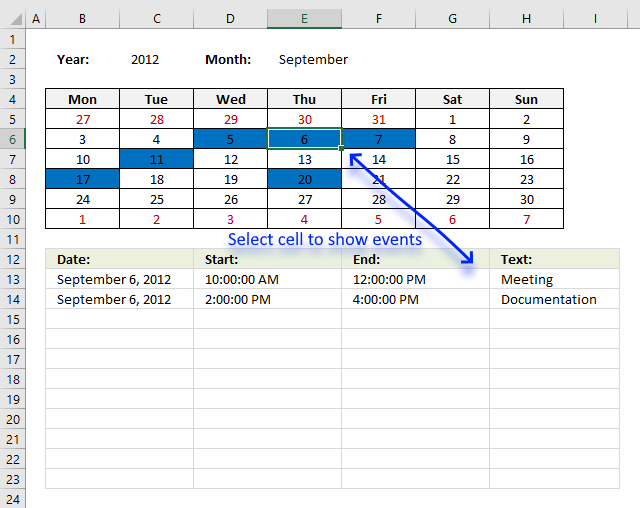
Excel calendar
Table of Contents Excel monthly calendar - VBA Calendar Drop down lists Headers Calculating dates (formula) Conditional formatting Today Dates […]
Table of Contents Excel monthly calendar - VBA Calendar Drop down lists Headers Calculating dates (formula) Conditional formatting Today Dates […]
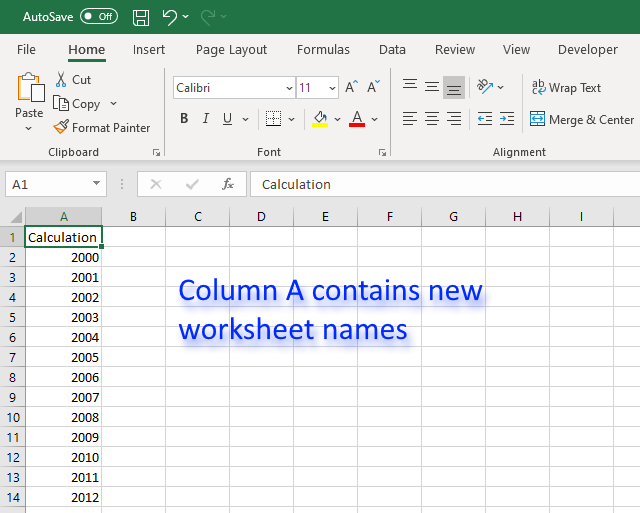
Create new worksheets programmatically based on values in a cell range [VBA]
This article demonstrates a macro that inserts new worksheets based on names in a cell range. The cell range may […]
This article demonstrates a macro that inserts new worksheets based on names in a cell range. The cell range may […]
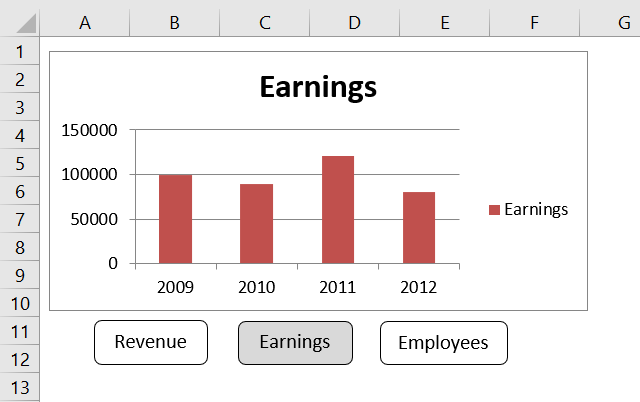
How to create an interactive Excel chart
Table of Contents How to create an interactive Excel chart How to filter chart data How to build an interactive […]
Table of Contents How to create an interactive Excel chart How to filter chart data How to build an interactive […]
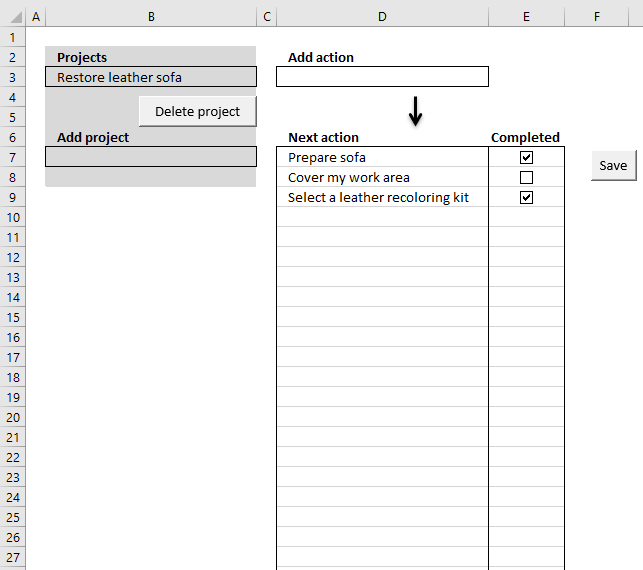
Excel template: Getting Things Done [VBA]
I am going to demonstrate a simple workbook where you can create or delete projects and add "next" actions to […]
I am going to demonstrate a simple workbook where you can create or delete projects and add "next" actions to […]
Auto resize columns as you type
Have you ever wanted Excel to react automatically when something changes in your spreadsheet? With Event Code in VBA you […]
Have you ever wanted Excel to react automatically when something changes in your spreadsheet? With Event Code in VBA you […]
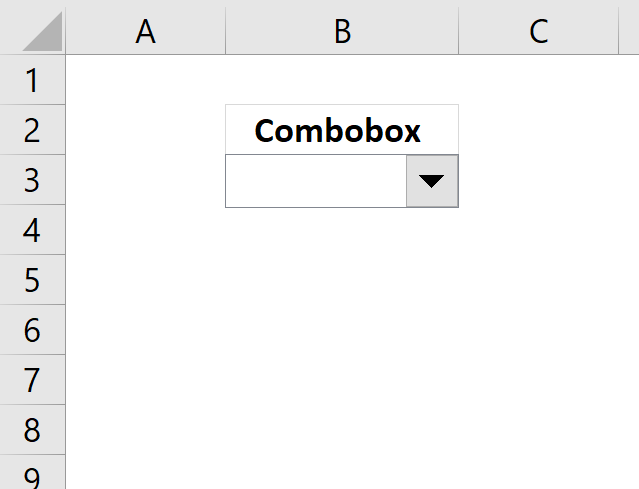
Working with COMBO BOXES [Form Controls]
This blog post demonstrates how to create, populate and change comboboxes (form control) programmatically. Form controls are not as flexible […]
This blog post demonstrates how to create, populate and change comboboxes (form control) programmatically. Form controls are not as flexible […]
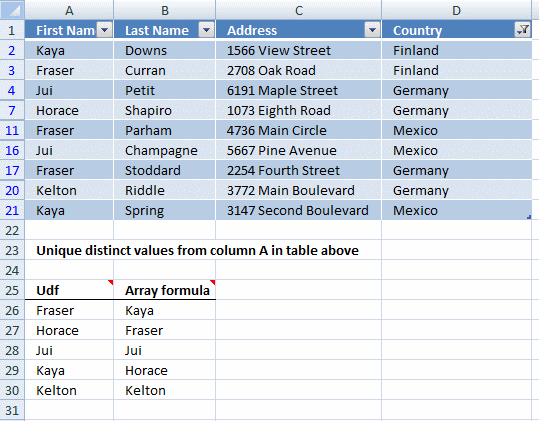
Extract unique distinct values from an Excel Table filtered list
This article demonstrates two formulas that extract distinct values from a filtered Excel Table, one formula for Excel 365 subscribers […]
This article demonstrates two formulas that extract distinct values from a filtered Excel Table, one formula for Excel 365 subscribers […]
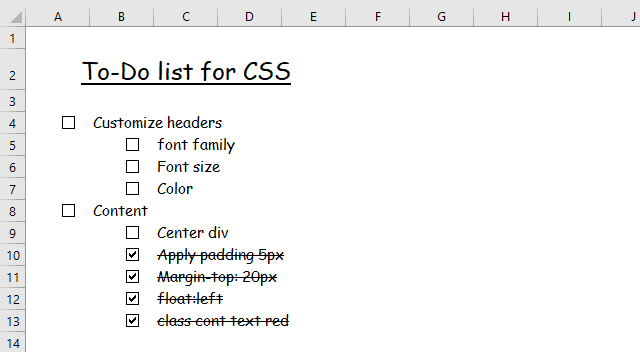
Add checkboxes and copy values – VBA
Check boxes in Excel are a great way to make your spreadsheets more interactive. They can be used for task […]
Check boxes in Excel are a great way to make your spreadsheets more interactive. They can be used for task […]
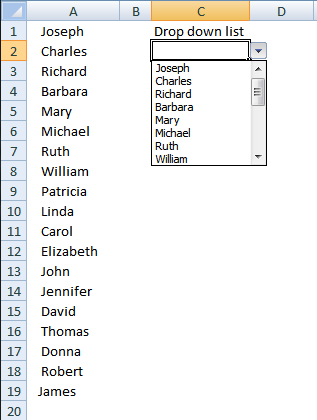
Add values to a regular drop-down list programmatically
Table of Contents Add values to a regular drop-down list programmatically How to insert a regular drop-down list Add values […]
Table of Contents Add values to a regular drop-down list programmatically How to insert a regular drop-down list Add values […]
Create a Print button – macro
This article describes how to create a button and place it on an Excel worksheet, then assign a macro to […]
This article describes how to create a button and place it on an Excel worksheet, then assign a macro to […]
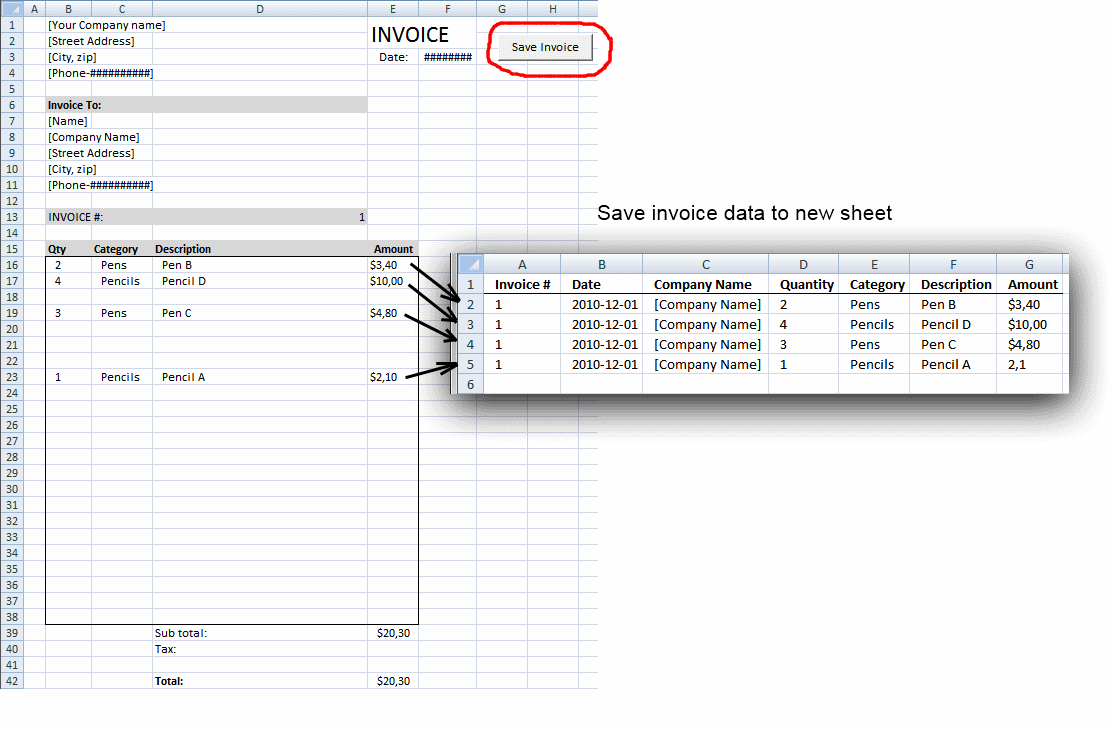
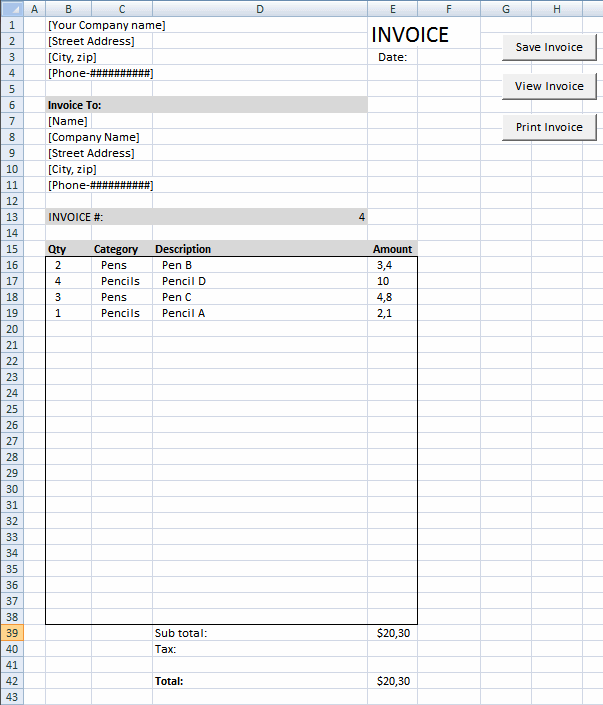
Save invoice data – VBA
Table of contents Save invoice data - VBA Invoice template with dependent drop down lists Select and view invoice - […]
Table of contents Save invoice data - VBA Invoice template with dependent drop down lists Select and view invoice - […]
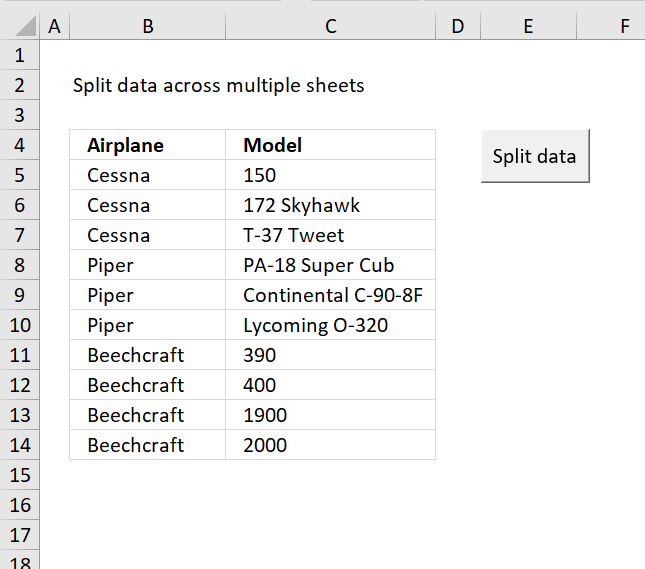
Split data across multiple sheets – VBA
Table of Contents Split data across multiple sheets - VBA Add values to worksheets based on a condition - VBA […]
Table of Contents Split data across multiple sheets - VBA Add values to worksheets based on a condition - VBA […]
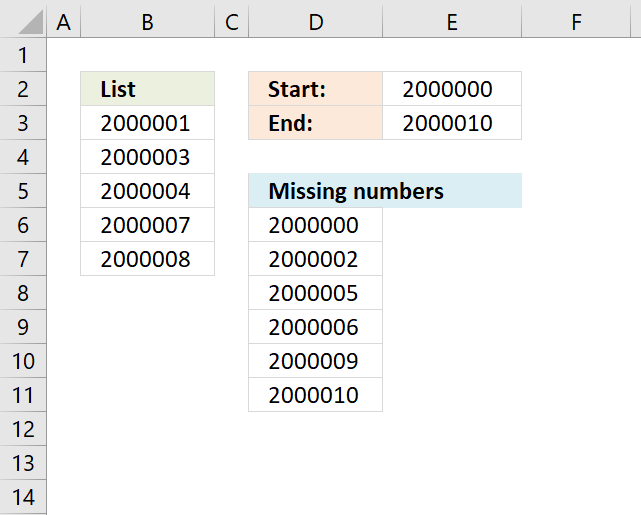
Find missing numbers
Table of Contents Find missing numbers in a column based on a given range Find missing three character alpha code […]
Table of Contents Find missing numbers in a column based on a given range Find missing three character alpha code […]