'AVERAGE function' category
AVERAGE based on criteria
This article demonstrates two formulas that calculate averages, the first formula calculates an average based on criteria, and the second […]
AVERAGE ignore NA()
The AVERAGE function ignores empty cells, text values, and boolean values automatically, however, it doesn't handle error values. The AVERAGE […]
How to AVERAGE time
Table of Contents How to AVERAGE time How to enter an array formula Explaining formula How to AVERAGE time hh […]
AVERAGE ignore blanks
Table of Contents AVERAGE ignore blanks Average - ignore blanks and errors Average - ignore blanks in non-contiguous cells Weighted […]
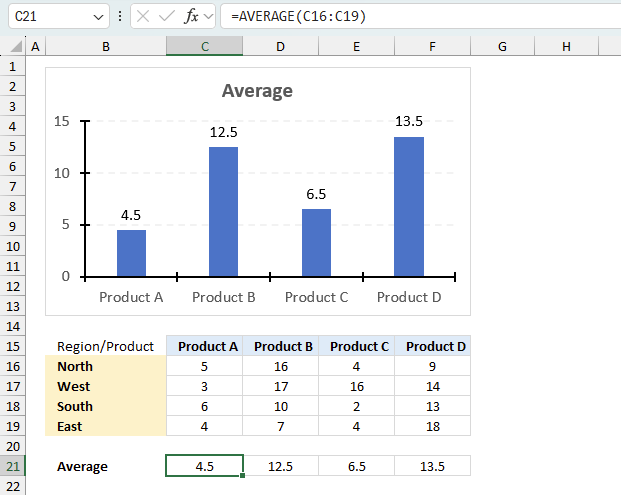
How to use the AVERAGE function
Calculates the average of numbers in a cell range. In other words, the sum of a group of numbers and […]
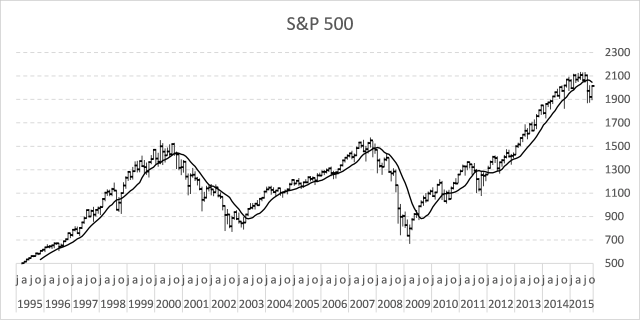
Follow stock market trends – Moving Average
In my previous post, I described how to build a dynamic stock chart that lets you easily adjust the date […]
Plot buy and sell points in an Excel Chart based on two moving averages
This article demonstrates how to display buy and sell signals on an Excel chart based on two moving averages, the […]
Add buy and sell points to a stock chart
The image above shows an Excel chart of the S&P 500 with buy and sell signals based on a 50 […]
Calculate running average of last 10 data with random blank cells
Question: List of data and blank cells in a column which will be added from day to day. There are […]
AVERAGE ignore 0 (zero)
The array formula in cell D3 calculates an average and ignores 0 (zeros). =AVERAGE(IF(B3:B8<>0,B3:B8,"")) The formula above is an array […]