'Finance' category
How to track sector performance in the stock market – Excel template
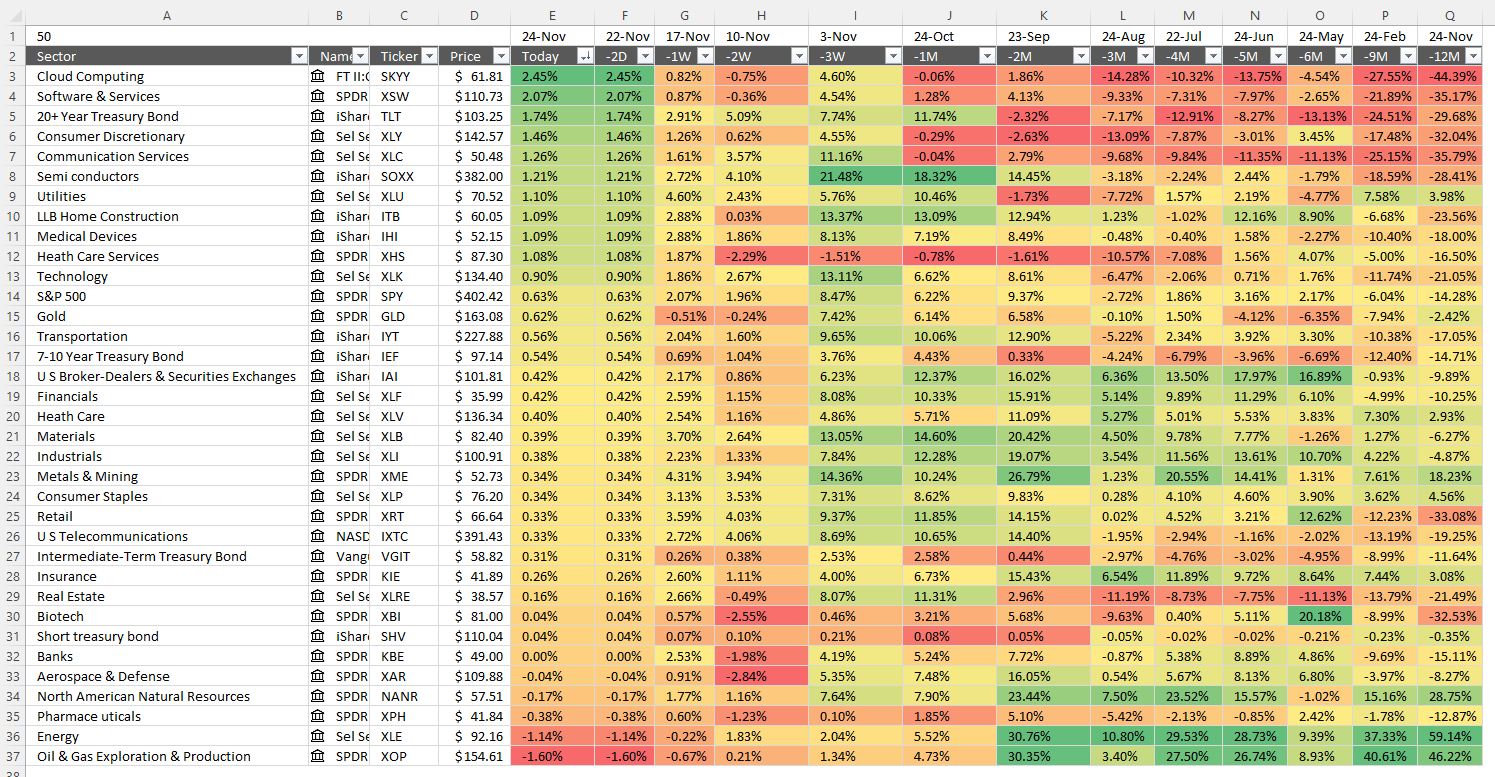
The image above shows the performance across industry groups for different date ranges, conditional formatting makes the table much easier […]
How to calculate and plot pivots on an Excel chart
If you study a stock chart you will discover that sometimes significant trend reversals happen when a stock chart […]
Follow stock market trends – trailing stop
This time I want to demonstrate an alternative way to identify a major trend in the stock market. The previous post […]
Follow stock market trends – Moving Average
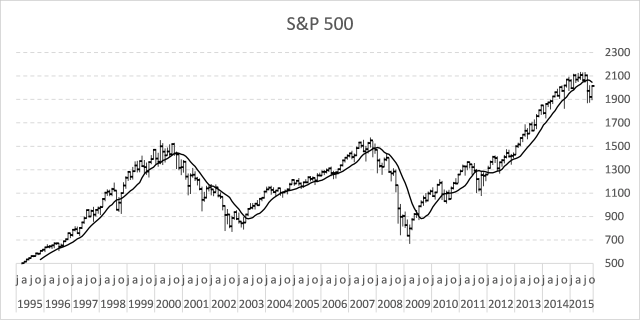
In my previous post, I described how to build a dynamic stock chart that lets you easily adjust the date […]
All you need to know about calculating NAV units for your stock portfolio
This blog article explains in greater detail how to determine stock portfolio performance based on units of NAV (Net Asset […]
How to calculate totals of stock transactions based on dates
Did you know that you can use a pivot table to summarize portfolio holdings at any point in time? If you trade […]
Compare the performance of your stock portfolio to S&P 500 using Excel
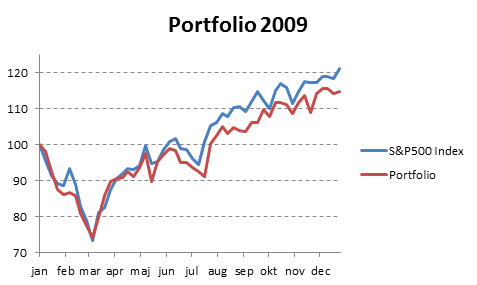
By comparing your stock portfolio performance to index S&P500 you know if the time you spent on analyzing companies paid […]
Plot buy and sell points in an Excel Chart based on two moving averages
This article demonstrates how to display buy and sell signals on an Excel chart based on two moving averages, the […]
Add buy and sell points to a stock chart
The image above shows an Excel chart of the S&P 500 with buy and sell signals based on a 50 […]
Bill reminder in excel
Brad asks: I'm trying to use your formulas to create my own bill reminder sheet. I envision a workbook where […]
Tracking a stock portfolio #2
This is follow up post to:Â Tracking a stock portfolio in excel (auto update) In this post we are going to […]
Tracking a stock portfolio in excel (auto update)
Question: I found a question here about tracking a stock portfolio. He would like to automatically create an overview table […]
Schedule recurring expenses in a calendar in excel (Personal Finance)
Below is an excel table containing recurring expenses and corresponding amounts, dates and recurring intervals. An excel table allows you to […]
Calculate your stock portfolio performance with Net Asset Value based on units in excel
In a previous related post we calculated the stock portfolio performance using the most current stock prices compared to buying […]
Automate net asset value (NAV) calculation on your stock portfolio
Introduction In this post I am creating a spreadsheet that will calculate stock portfolio performance. To do this I am […]
Excel formula categories
AverageChooseCombine MergeCompareConcatenateConditional FormattingCountCount valuesDatesDuplicatesExtractFilterFilter recordsFiltered valuesFilterxmlHyperlinkIf cellIndex MatchLogicLookupsMatchMaxMinNumbers in sumOR logicOverlappingPartial matchRecordsSequenceSmallSort bySort valuesSumSumifsSumproductString manipulationTimeUnique distinct recordsUnique distinct valuesUnique recordsUnique valuesVlookupVlookup return values