'YEAR function' category
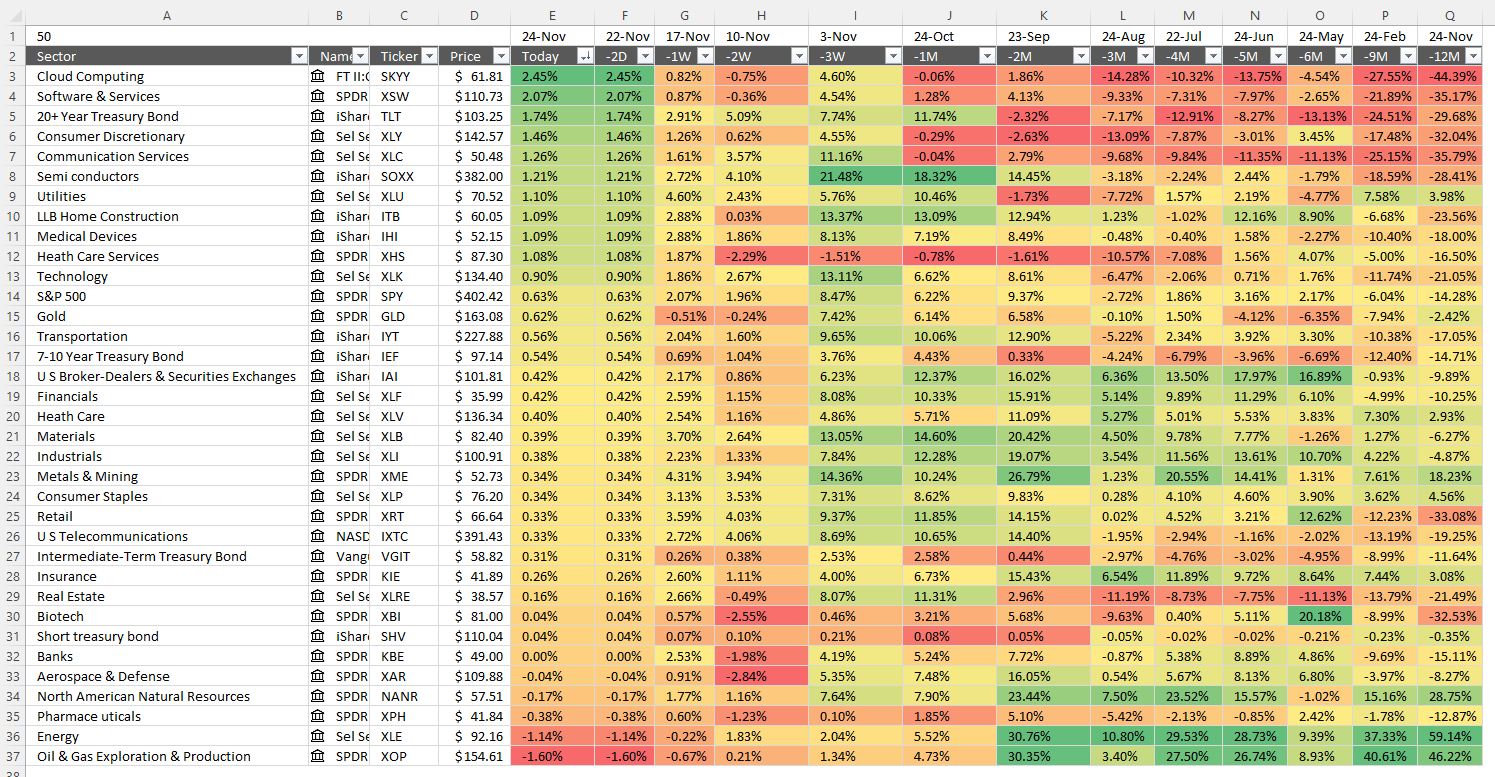
How to track sector performance in the stock market – Excel template
The image above shows the performance across industry groups for different date ranges, conditional formatting makes the table much easier […]
The image above shows the performance across industry groups for different date ranges, conditional formatting makes the table much easier […]
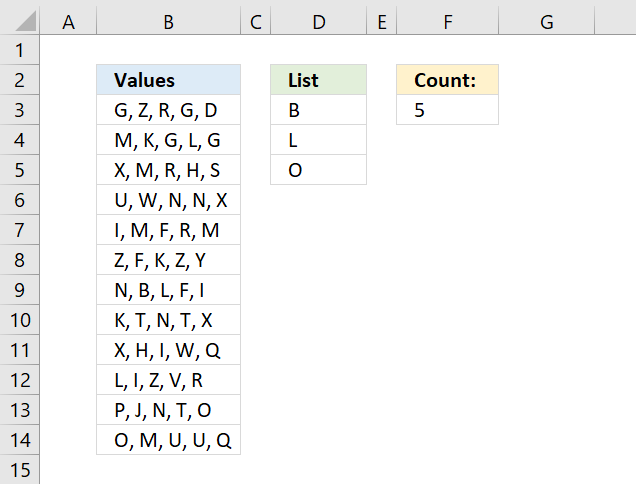
Count cells containing text from list
Table of Contents Count cells containing text from list Count entries based on date and time Count cells with text […]
Table of Contents Count cells containing text from list Count entries based on date and time Count cells with text […]
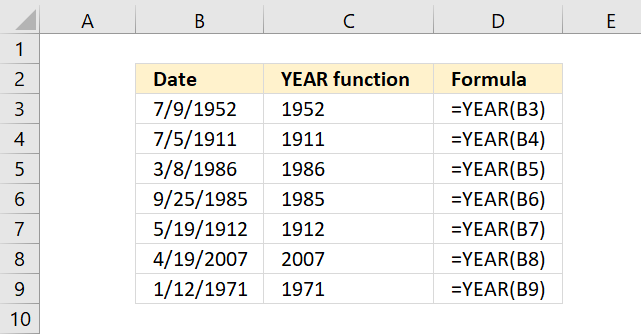
How to use the YEAR function
What is the YEAR function? The YEAR function converts a date to a number representing the year in the date. […]
What is the YEAR function? The YEAR function converts a date to a number representing the year in the date. […]
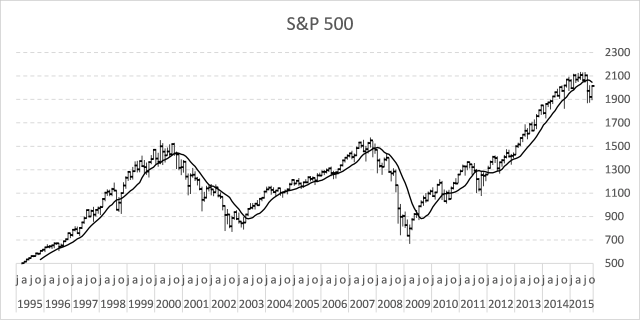
Follow stock market trends – Moving Average
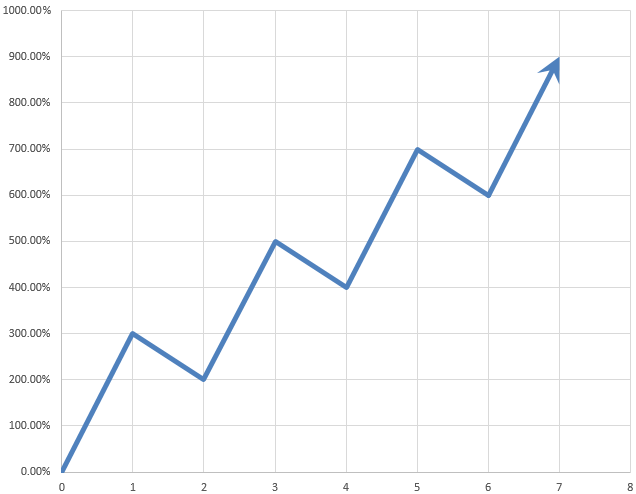
In my previous post, I described how to build a dynamic stock chart that lets you easily adjust the date […]
In my previous post, I described how to build a dynamic stock chart that lets you easily adjust the date […]
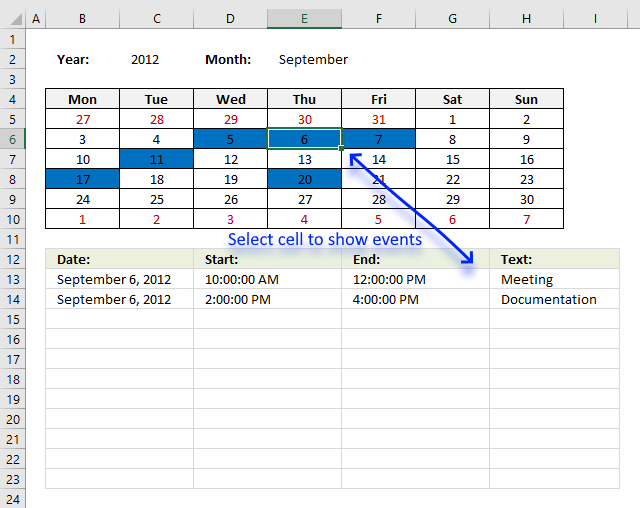
Yet another Excel Calendar
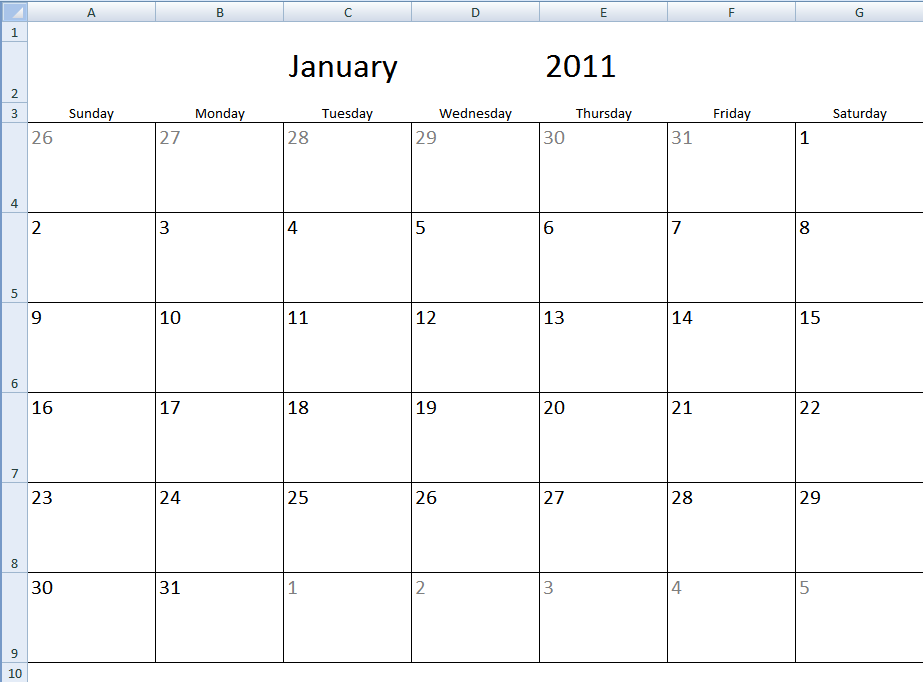
The image above demonstrates a calendar in Excel that allows you to: Add events. An event contains a date and […]
The image above demonstrates a calendar in Excel that allows you to: Add events. An event contains a date and […]
Working with date ranges
Table of Contents Find date range based on a date Sort dates within a date range Create date ranges that […]
Table of Contents Find date range based on a date Sort dates within a date range Create date ranges that […]
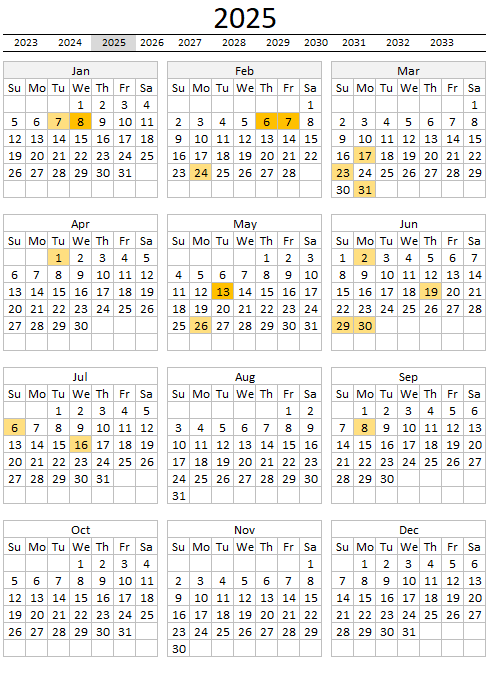
Excel calendar
Table of Contents Excel monthly calendar - VBA Calendar Drop down lists Headers Calculating dates (formula) Conditional formatting Today Dates […]
Table of Contents Excel monthly calendar - VBA Calendar Drop down lists Headers Calculating dates (formula) Conditional formatting Today Dates […]
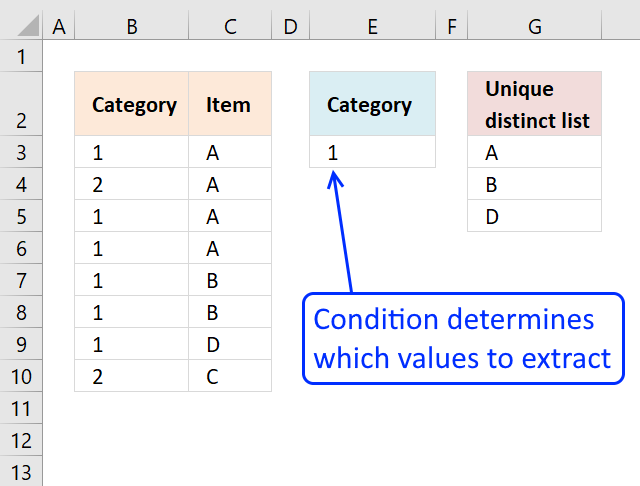
VLOOKUP – Return multiple unique distinct values
This article shows how to extract unique distinct values based on a condition applied to an adjacent column using formulas. […]
This article shows how to extract unique distinct values based on a condition applied to an adjacent column using formulas. […]
Monthly calendar template
Table of Contents Monthly calendar template Monthly calendar template 2 Calendar - monthly view - Excel 365 Calendar - monthly […]
Table of Contents Monthly calendar template Monthly calendar template 2 Calendar - monthly view - Excel 365 Calendar - monthly […]
Automate net asset value (NAV) calculation on your stock portfolio
Table of Contents Automate net asset value (NAV) calculation on your stock portfolio Calculate your stock portfolio performance with Net […]
Table of Contents Automate net asset value (NAV) calculation on your stock portfolio Calculate your stock portfolio performance with Net […]
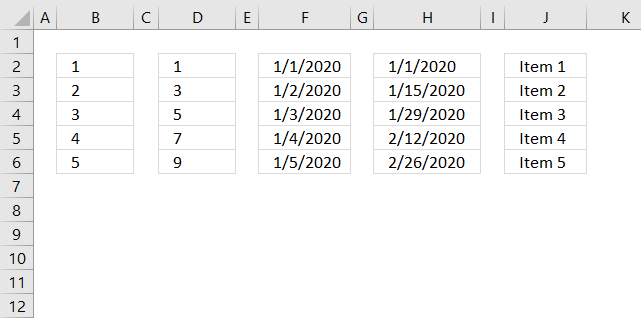
Create number series
Excel has a great built-in tool for creating number series named Autofill. The tool is great, however, in some situations, […]
Excel has a great built-in tool for creating number series named Autofill. The tool is great, however, in some situations, […]
Extract a list of duplicates from a column
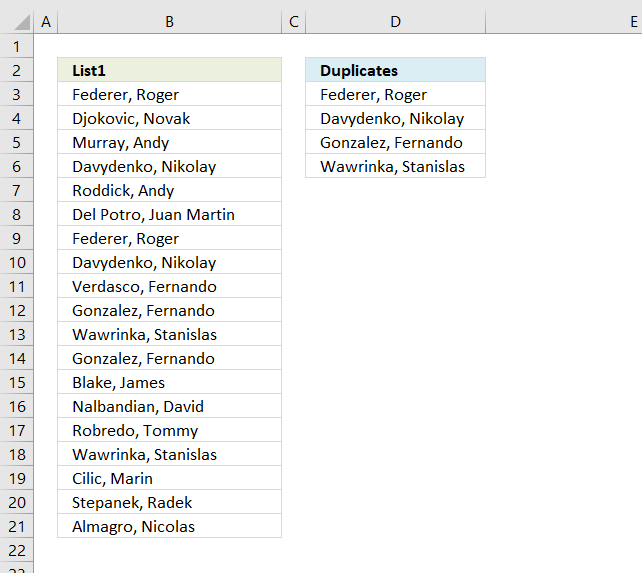
The array formula in cell C2 extracts duplicate values from column A. Only one duplicate of each value is displayed […]
The array formula in cell C2 extracts duplicate values from column A. Only one duplicate of each value is displayed […]
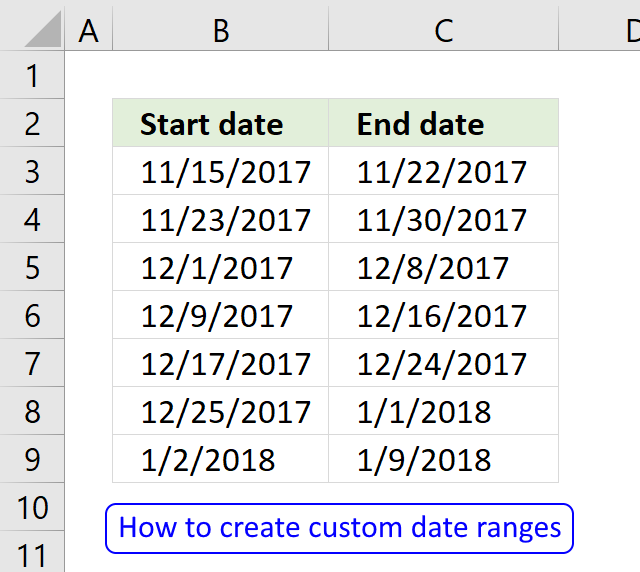
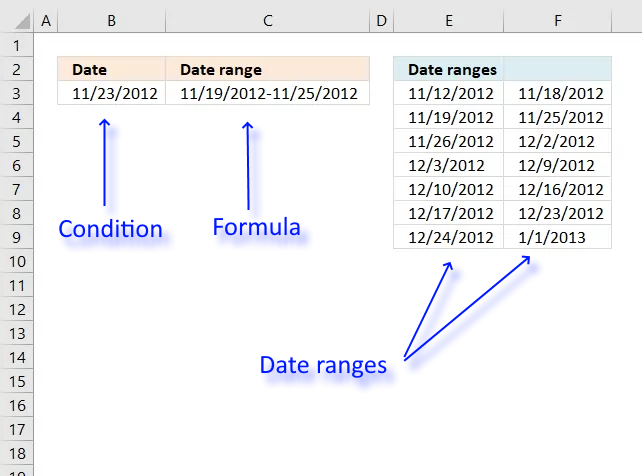
How to create date ranges in Excel
Question: I am trying to create an excel spreadsheet that has a date range. Example: Cell A1 1/4/2009-1/10/2009 Cell B1 […]
Question: I am trying to create an excel spreadsheet that has a date range. Example: Cell A1 1/4/2009-1/10/2009 Cell B1 […]
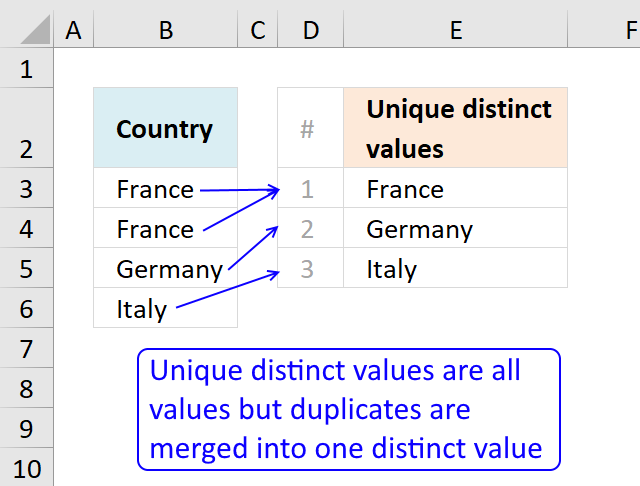
Count unique distinct values
This article describes how to count unique distinct values. What are unique distinct values? They are all values but duplicates are […]
This article describes how to count unique distinct values. What are unique distinct values? They are all values but duplicates are […]
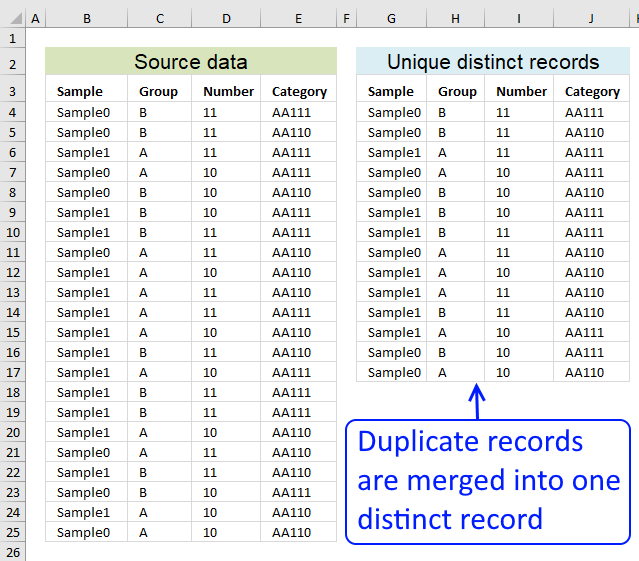
Filter unique distinct records
Table of contents Filter unique distinct row records Filter unique distinct row records but not blanks Filter unique distinct row […]
Table of contents Filter unique distinct row records Filter unique distinct row records but not blanks Filter unique distinct row […]
Excel formula categories
AverageChooseCombine MergeCompareConcatenateConditional FormattingCountCount valuesDatesDuplicatesExtractFilterFilter recordsFiltered valuesFilterxmlHyperlinkIf cellIndex MatchLogicLookupsMatchMaxMinNumbers in sumOR logicOverlappingPartial matchRecordsSequenceSmallSort bySort valuesSumSumifsSumproductString manipulationTimeUnique distinct recordsUnique distinct valuesUnique recordsUnique valuesVlookupVlookup return values