How to use the STOCKHISTORY function

What is the STOCKHISTORY function?
The STOCKHISTORY function lets you get stock prices based on a stock quote. It is in the Lookup and reference category and is available to Excel 365 subscribers.
The image above shows a dynamic array formula in cell B6:
The function uses the stock quote in specified in cell C2, the start date in cell C3, and the end date in cell C4 to get stock prices.
The formula returns an array of values to cells below and to the right of cell C6.
What's on this page
- Introduction
- Syntax
- How to get daily historical stock prices in Excel
- How to get weekly historical stock prices
- How to get historical monthly stock prices
- How to get historical closing stock prices
- How to get volume for a stock quote on a given day
- How to calculate a moving average
- Function not working
- Get Excel file
1. Introduction
What are stocks?
Stocks or equities represent ownership in a company. When you buy a stock you buy a small portion of that company's assets and profits. Stocks are traded on stock exchanges, such as the New York Stock Exchange (NYSE) or NASDAQ, and their prices can fluctuate based on various market and economic factors.
What are historical stock prices?
Historical stock prices refer to the past prices of a stock over a specific period of time. These prices can be used to analyze the stock's performance, identify trends, and make informed investment decisions.
Can you plot historical stock prices in Excel?
Yes, you can plot historical stock prices in Excel. Get historical stock prices using the STOCKHISTORY function, then plot the prices. You have four stock chart options:
- High-Low-Close chart
- Open-High-Low-Close chart
- Volume-High-Low-Close chart
- Volume-High-Low-Close chart
Here is how:
- Select the range containing the data points.
- Go to tab "Insert" on the ribbon.
- Press with mouse on "Recommended charts" button. A dialog box appears.
- Go to tab "All charts" located on the dialog box.
- Press with left mouse button on the "Stock" category.
- Pick a stock chart.
A more detailed demonstration is here: How to create a stock chart
What is a moving average?
A moving average is a statistical calculation that takes the average of a set of data points over a specific period of time. In the context of stock prices a moving average is a calculation that takes the average of a stock's price over a certain number of days, weeks, or months. The average is then plotted on a chart, and the line is "moving" because it is constantly being updated as new data points are added.
What is technical analysis?
Technical stock analysis is a method of evaluating a stock's potential for future price movements based on its past price and volume data. Technical analysts use charts and other tools to identify patterns and trends in a stock's price movement and to make predictions about future price movements. Technical analysis is based on the idea that a stock's price reflects all publicly available information about the company and that by analyzing the price movement an analyst can gain insights into the stock's future potential. Technical analysts use a variety of tools and techniques including charts, trend lines, and indicators, to analyze a stock's price movement and make predictions.
What is fundamental analysis?
Fundamental stock analysis, on the other hand is a method of evaluating a stock's potential for future price movements based on the company's underlying financial performance. Fundamental analysts examine a company's financial statements, management team, industry trends, and competitive position to estimate its future earnings and cash flow. Fundamental analysts use a variety of tools and techniques, including financial ratios, industry analysis, and competitive analysis, to evaluate a stock's potential.
2. Syntax

STOCKHISTORY(stock, start_date, [end_date], [interval], [headers], [property0], [property1], [property2], [property3], [property4], [property5])

| Argument | Text |
| stock | Required. A stock ticker or a reference to a stock ticker. |
| start_date | Required. The first date to start retrieving stock prices for. |
| [end_date] | Optional. The last date to start retrieving stock prices for. |
| [interval] | Optional. Specify the interval. 0 = daily (default) 1 = weekly 2 = monthly |
| [headers] | Optional. Enable header names. 0 = no headers 1 = show headers (default) 2 = show instrument identifier and headers |
| [property0] | Optional. Which columns to show: 0 = Date 1 = Close 2 = Open 3 = High 4 = Low 5 = Volume |
| [property1] | Optional. See [property0] above. |
| [property2] | Optional. See [property0] above. |
| [property3] | Optional. See [property0] above. |
| [property4] | Optional. See [property0] above. |
| [property5] | Optional. See [property0] above. |
3. How to get daily stock prices in Excel
The STOCKHISTORY function retrieves historical stock prices for a given ticker. You can specify the interval meaning daily, weekly or monthly prices.
The image above demonstrates the STOCKHISTORY function in cell B6, it returns in this example historical daily stock prices for Microsoft between 10/14/2021 and 10/28/2021 specified in cells C3 and C4.
Change the ticker and date range in cells C2:C4 and the function automatically returns data based on the new conditions.
The image above shows a dynamic array formula in cell B6:
The formula above returns header names shown in row 7 as well as the ticker in cell B6. Date, Close, Open, High, Low, and Volume data is returned in this example, however, you can choose the order and what to include using the optional arguments in positions six to eleven.
4. How to get weekly stock prices

The image above demonstrates how to return weekly stock prices using the STOCKHISTORY function.
The image above shows a dynamic array formula in cell B6:
5. How to get monthly stock prices

The formula above demonstrates how to get monthly stock prices.
Dynamic array formula in cell B6:
6. How to get daily closing stock prices

The image above shows a dynamic array formula in cell B6:
7. How to get volume for a stock quote on a given day

The image above demonstrates a formula returning volume data for a stock ticker specified in cell C2.
Dynamic array formula in cell B6:
8. How to calculate a moving average

The image above demonstrates a formula in cell F33 that calculates the average based on the previous 10 days' closing price.
Dynamic array formula in cell B6:
The AVERAGE function calculates the average based on a group of numbers. 10-day, 20 day, 50-day, and 200-day averages are often used to calculate the short trend, medium trend, and long trend direction.
How to plot a moving average on a stock chart
9. Function not working
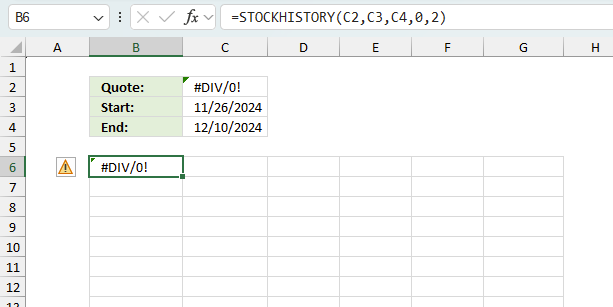
The STOCKHISTORY function returns
- #VALUE! error if you use the wrong number of arguments.
- #NAME? error if you misspell the function name.
- propagates errors, meaning that if the input contains an error (e.g., #VALUE!, #REF!), the function will return the same error.
9.1 Troubleshooting the error value
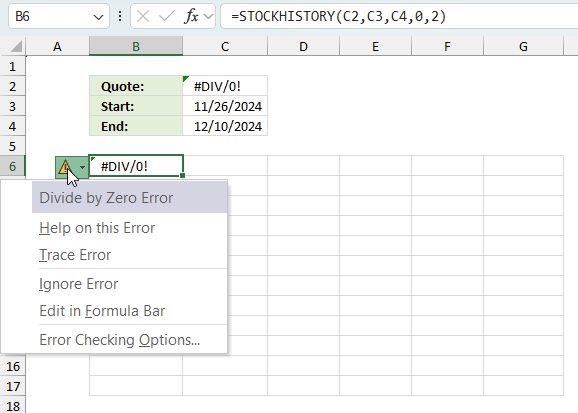
When you encounter an error value in a cell a warning symbol appears, displayed in the image above. Press with mouse on it to see a pop-up menu that lets you get more information about the error.
- The first line describes the error if you press with left mouse button on it.
- The second line opens a pane that explains the error in greater detail.
- The third line takes you to the "Evaluate Formula" tool, a dialog box appears allowing you to examine the formula in greater detail.
- This line lets you ignore the error value meaning the warning icon disappears, however, the error is still in the cell.
- The fifth line lets you edit the formula in the Formula bar.
- The sixth line opens the Excel settings so you can adjust the Error Checking Options.
Here are a few of the most common Excel errors you may encounter.
#NULL error - This error occurs most often if you by mistake use a space character in a formula where it shouldn't be. Excel interprets a space character as an intersection operator. If the ranges don't intersect an #NULL error is returned. The #NULL! error occurs when a formula attempts to calculate the intersection of two ranges that do not actually intersect. This can happen when the wrong range operator is used in the formula, or when the intersection operator (represented by a space character) is used between two ranges that do not overlap. To fix this error double check that the ranges referenced in the formula that use the intersection operator actually have cells in common.
#SPILL error - The #SPILL! error occurs only in version Excel 365 and is caused by a dynamic array being to large, meaning there are cells below and/or to the right that are not empty. This prevents the dynamic array formula expanding into new empty cells.
#DIV/0 error - This error happens if you try to divide a number by 0 (zero) or a value that equates to zero which is not possible mathematically.
#VALUE error - The #VALUE error occurs when a formula has a value that is of the wrong data type. Such as text where a number is expected or when dates are evaluated as text.
#REF error - The #REF error happens when a cell reference is invalid. This can happen if a cell is deleted that is referenced by a formula.
#NAME error - The #NAME error happens if you misspelled a function or a named range.
#NUM error - The #NUM error shows up when you try to use invalid numeric values in formulas, like square root of a negative number.
#N/A error - The #N/A error happens when a value is not available for a formula or found in a given cell range, for example in the VLOOKUP or MATCH functions.
#GETTING_DATA error - The #GETTING_DATA error shows while external sources are loading, this can indicate a delay in fetching the data or that the external source is unavailable right now.
9.2 The formula returns an unexpected value
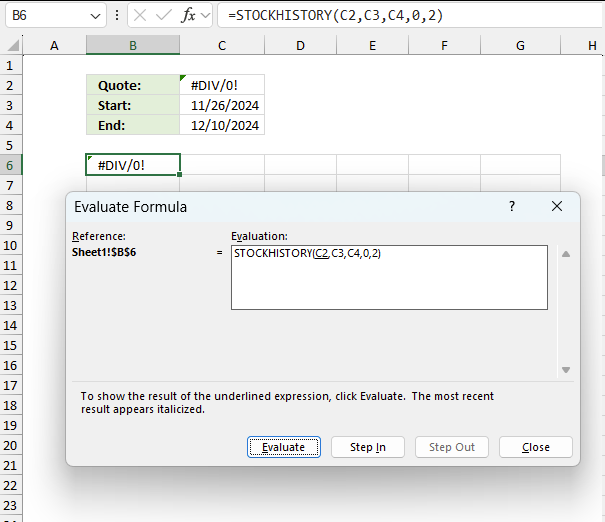
To understand why a formula returns an unexpected value we need to examine the calculations steps in detail. Luckily, Excel has a tool that is really handy in these situations. Here is how to troubleshoot a formula:
- Select the cell containing the formula you want to examine in detail.
- Go to tab “Formulas” on the ribbon.
- Press with left mouse button on "Evaluate Formula" button. A dialog box appears.
The formula appears in a white field inside the dialog box. Underlined expressions are calculations being processed in the next step. The italicized expression is the most recent result. The buttons at the bottom of the dialog box allows you to evaluate the formula in smaller calculations which you control. - Press with left mouse button on the "Evaluate" button located at the bottom of the dialog box to process the underlined expression.
- Repeat pressing the "Evaluate" button until you have seen all calculations step by step. This allows you to examine the formula in greater detail and hopefully find the culprit.
- Press "Close" button to dismiss the dialog box.
There is also another way to debug formulas using the function key F9. F9 is especially useful if you have a feeling that a specific part of the formula is the issue, this makes it faster than the "Evaluate Formula" tool since you don't need to go through all calculations to find the issue..
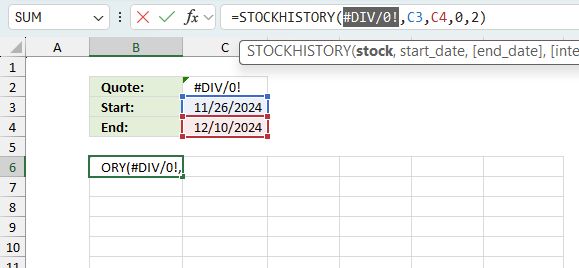
- Enter Edit mode: Double-press with left mouse button on the cell or press F2 to enter Edit mode for the formula.
- Select part of the formula: Highlight the specific part of the formula you want to evaluate. You can select and evaluate any part of the formula that could work as a standalone formula.
- Press F9: This will calculate and display the result of just that selected portion.
- Evaluate step-by-step: You can select and evaluate different parts of the formula to see intermediate results.
- Check for errors: This allows you to pinpoint which part of a complex formula may be causing an error.
The image above shows cell reference C2 converted to hard-coded value using the F9 key. The STOCKHISTORY function requires non-error values in the first argument which is not the case in this example. We have found what is wrong with the formula.
Tips!
- View actual values: Selecting a cell reference and pressing F9 will show the actual values in those cells.
- Exit safely: Press Esc to exit Edit mode without changing the formula. Don't press Enter, as that would replace the formula part with the calculated value.
- Full recalculation: Pressing F9 outside of Edit mode will recalculate all formulas in the workbook.
Remember to be careful not to accidentally overwrite parts of your formula when using F9. Always exit with Esc rather than Enter to preserve the original formula. However, if you make a mistake overwriting the formula it is not the end of the world. You can “undo” the action by pressing keyboard shortcut keys CTRL + z or pressing the “Undo” button
9.3 Other errors
Floating-point arithmetic may give inaccurate results in Excel - Article
Floating-point errors are usually very small, often beyond the 15th decimal place, and in most cases don't affect calculations significantly.
10. Get Excel file
Useful links
STOCKHISTORY function - Microsoft
'STOCKHISTORY' function examples
In my previous post, I described how to build a dynamic stock chart that lets you easily adjust the date […]
Functions in 'Lookup and reference' category
The STOCKHISTORY function function is one of 25 functions in the 'Lookup and reference' category.
How to comment
How to add a formula to your comment
<code>Insert your formula here.</code>
Convert less than and larger than signs
Use html character entities instead of less than and larger than signs.
< becomes < and > becomes >
How to add VBA code to your comment
[vb 1="vbnet" language=","]
Put your VBA code here.
[/vb]
How to add a picture to your comment:
Upload picture to postimage.org or imgur
Paste image link to your comment.
Contact Oscar
You can contact me through this contact form