Statistical functions
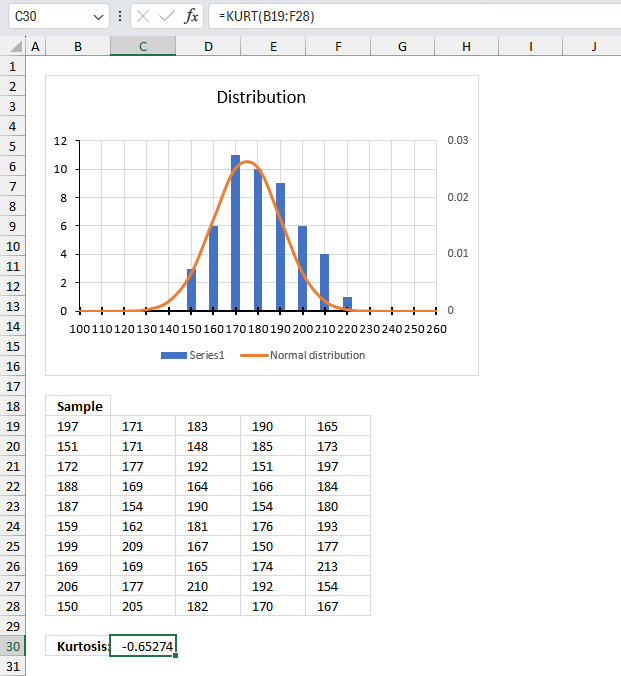
What is the KURT function? The KURT function lets you calculate the sample excess kurtosis in Excel. The kurtosis shows […]
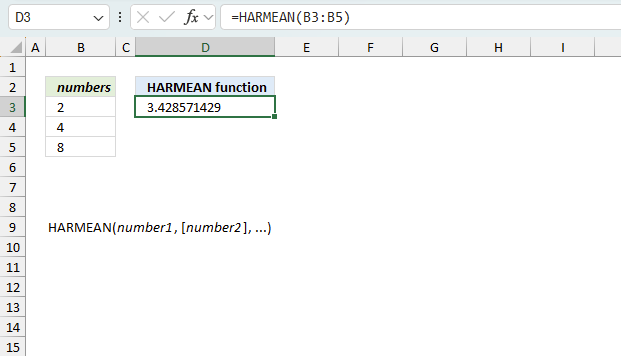
How to use the HARMEAN function
What is the HARMEAN function? The HARMEAN function lets you calculate the harmonic mean in Excel. Table of contents Introduction […]
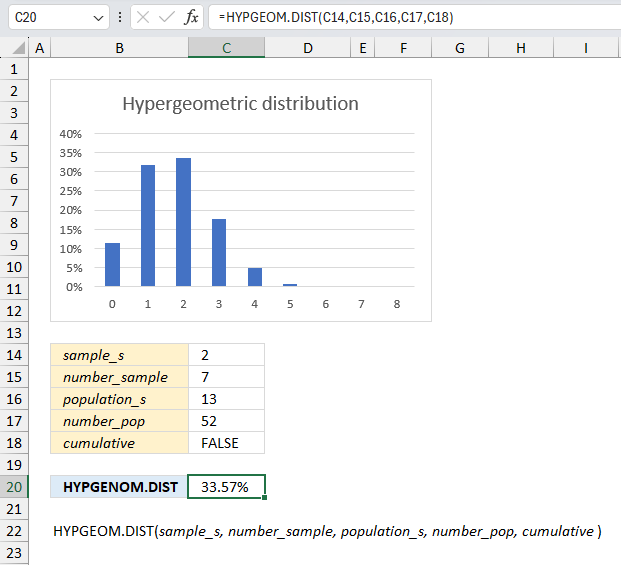
How to use the HYPGEOM.DIST function
What is the HYPGEOM.DIST function? The HYPGEOM.DIST function calculates the hypergeometric distribution. Table of Contents Introduction Syntax Arguments Example 1 […]
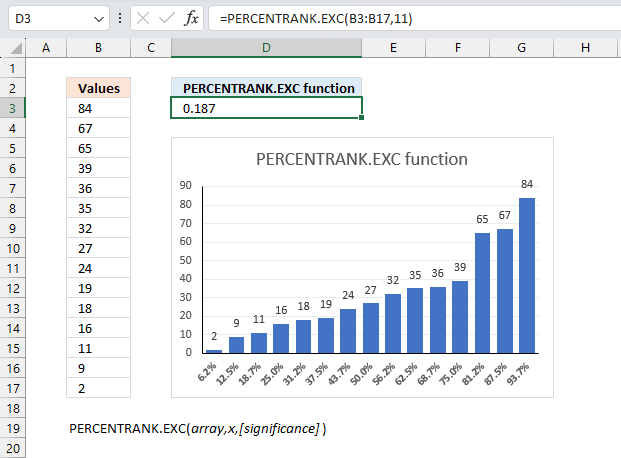
How to use the PERCENTRANK.EXC function
What is the PERCENTRANK.EXC function? The PERCENTRANK.EXC function calculates the percentage rank of a given number in a data set. […]
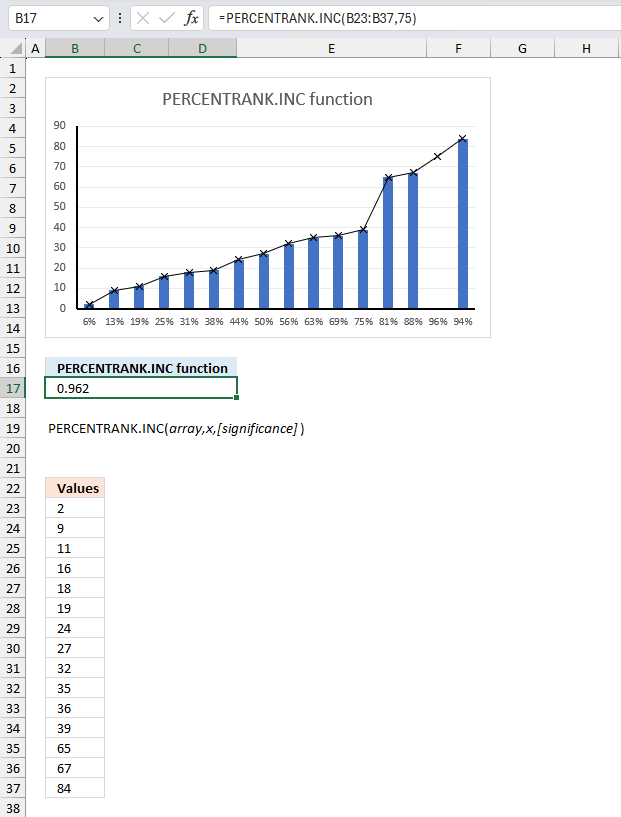
How to use the PERCENTRANK.INC function
What is the PERCENTRANK.INC function? The PERCENTRANK.INC function calculates the percent rank of a given number compared to the whole […]
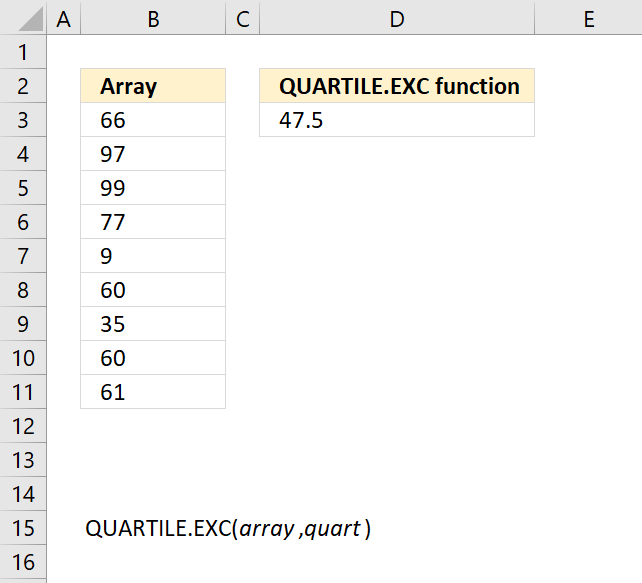
How to use the QUARTILE.EXC function
What is the QUARTILE.EXC function? The QUARTILE.EXC function returns the quartile of a data set, use this function function to […]
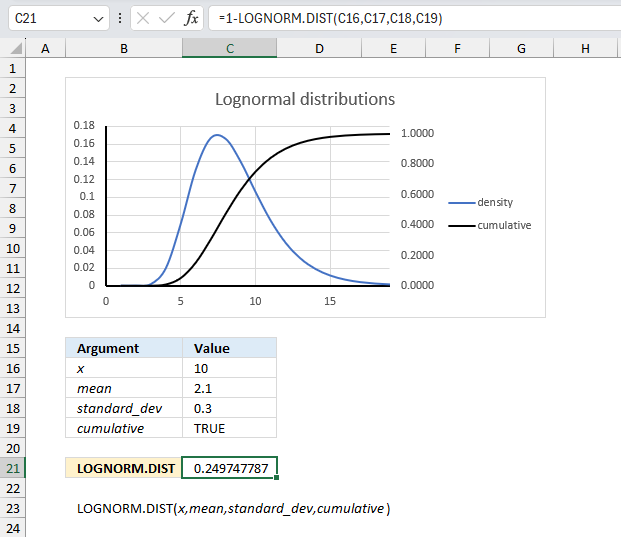
How to use the LOGNORM.DIST function
What is the LOGNORM.DIST function? The LOGNORMDIST function calculates the probabiltity based on the lognormal distribution of argument x, mean, […]
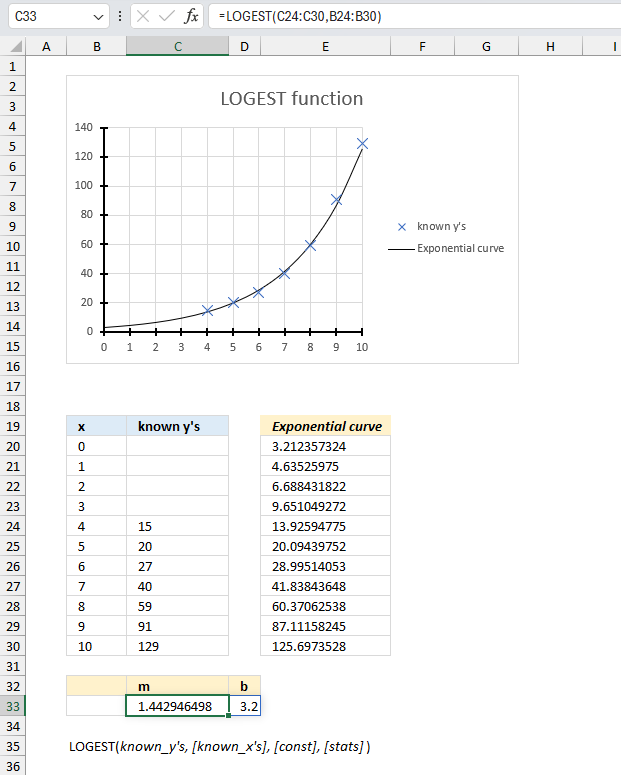
How to use the LOGEST function
What is the LOGEST function? The LOGEST function returns an array of values representing the parameters of an exponential curve […]
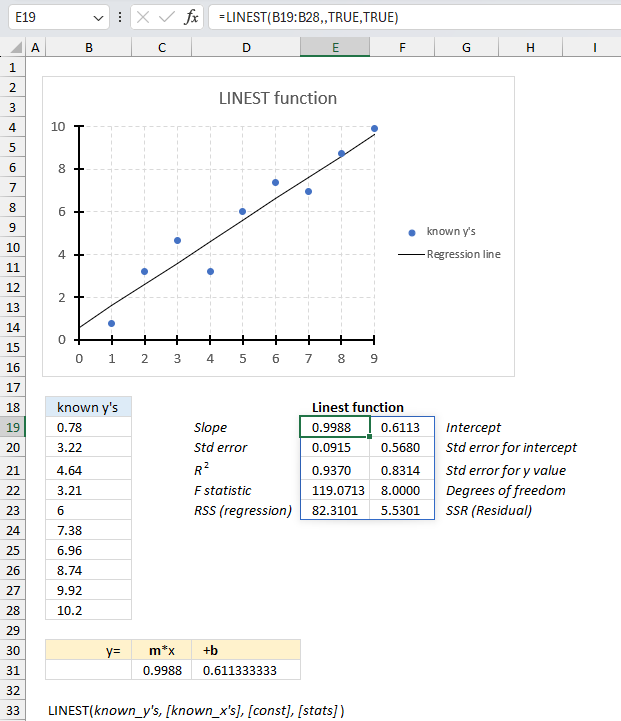
How to use the LINEST function
What is the LINEST function? The LINEST function returns an array of values representing the parameters of a straight line […]
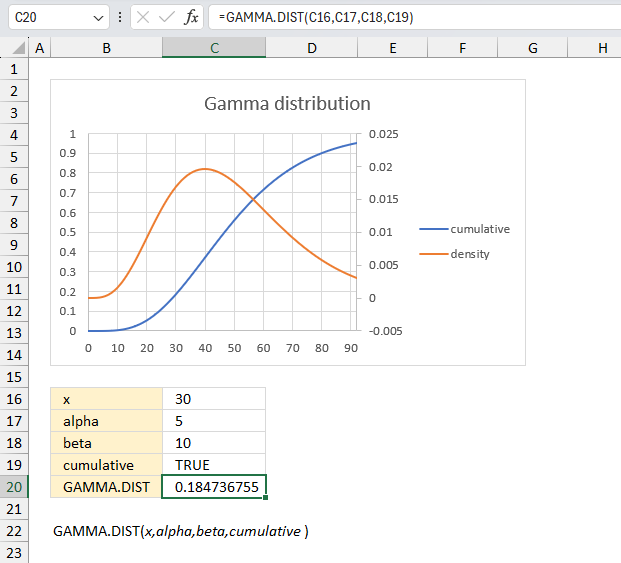
How to use the GAMMA.DIST function
How to use the GAMMA.DIST function? The GAMMA.DIST function calculates the gamma often used in queuing analysis (probability statistics) that […]
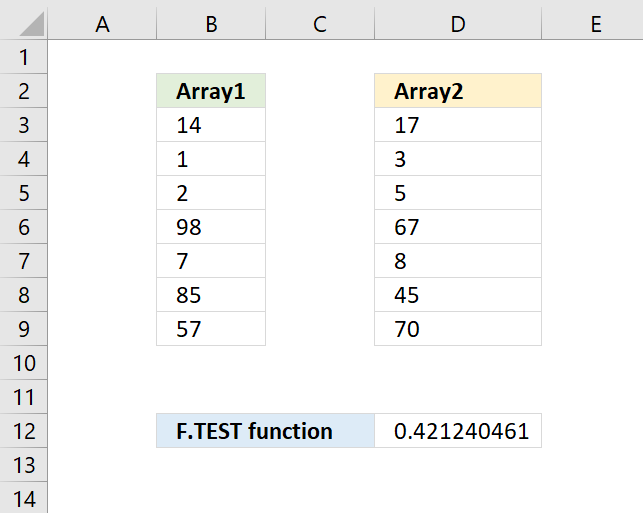
How to use the F.TEST function
What is the F.TEST function? The F.TEST function calculates the two-tailed probability from an F-test, the value shows if the […]
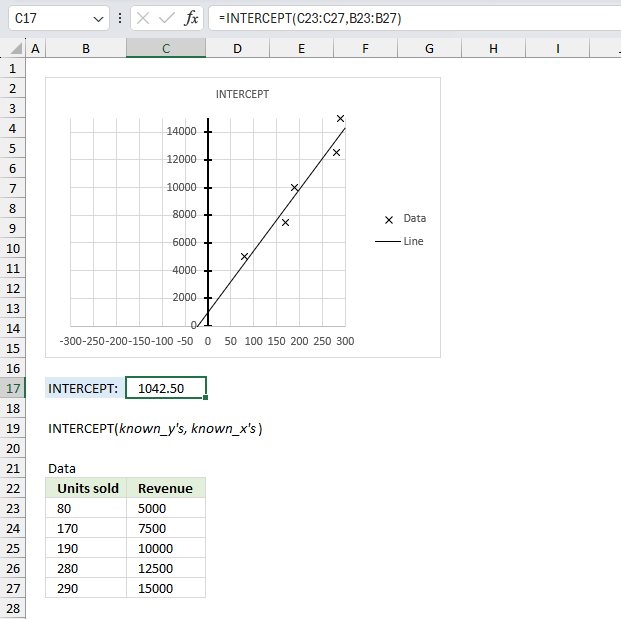
How to use the INTERCEPT function
What is the INTERCEPT function? The INTERCEPT function returns a value representing the y-value where a line intersects the y-axis. […]
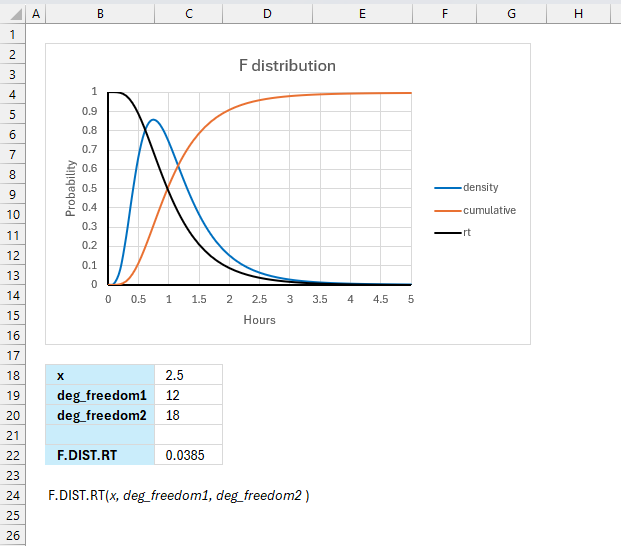
How to use the F.DIST.RT function
What is the F.DIST.RT function? The F.DIST.RT function calculates the right-tailed F probability for two tests. This function was introduced in […]
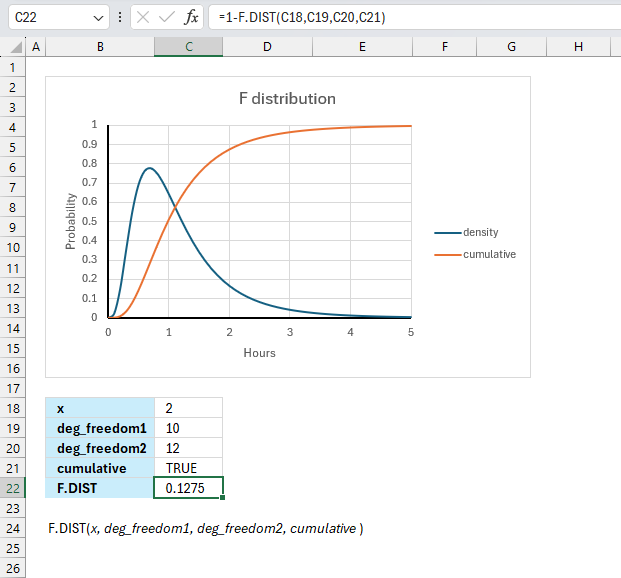
How to use the F.DIST function
What is the F.DIST function? The F.DIST function calculates the F probability for two tests. This function was introduced in […]
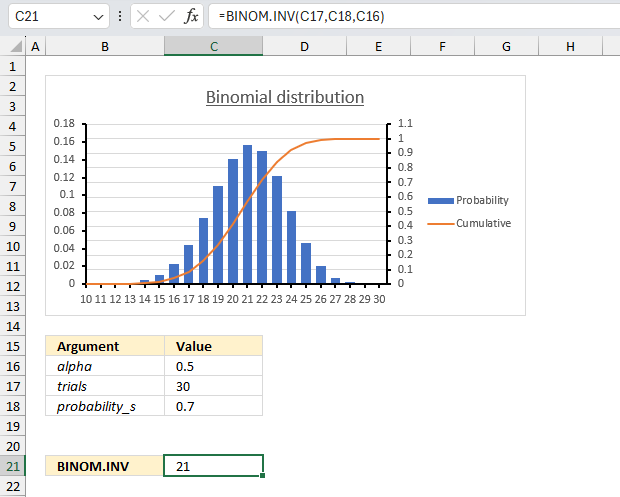
How to use the BINOM.INV function
What is the BINOM.INV function? The BINOM.INV function calculates the minimum value for which the cumulative binomial distribution is equal […]
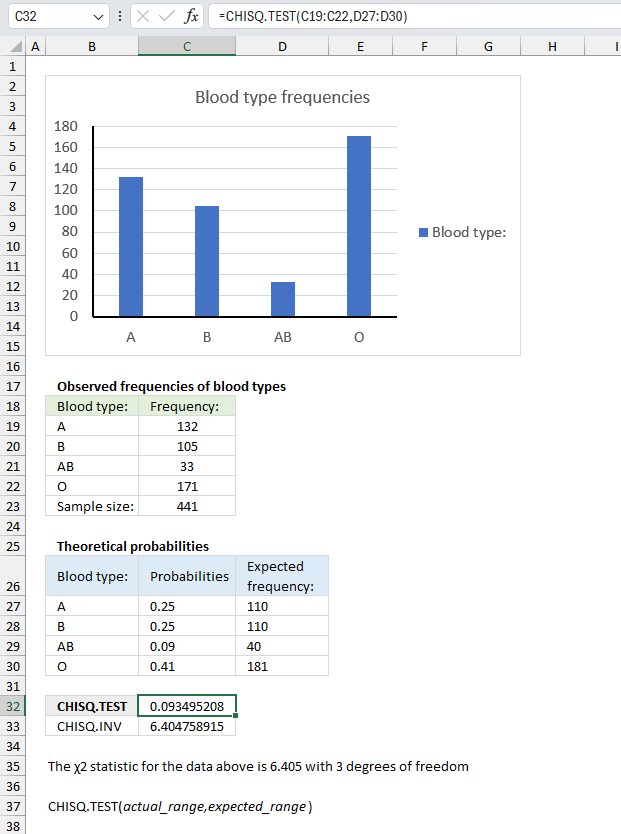
How to use the CHISQ.TEST function
What is the CHISQ.TEST function? The CHISQ.TEST function calculates the test for independence, the value returned from the chi-squared statistical […]
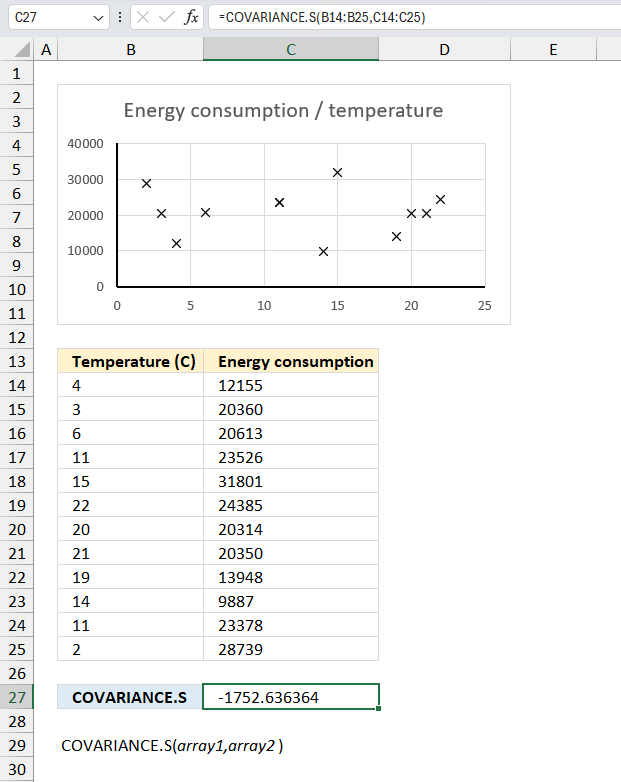
How to use the COVARIANCE.S function
What is the COVARIANCE.S function? The COVARIANCE.S function calculates the sample covariance from two different datasets. Table of Contents Introduction […]
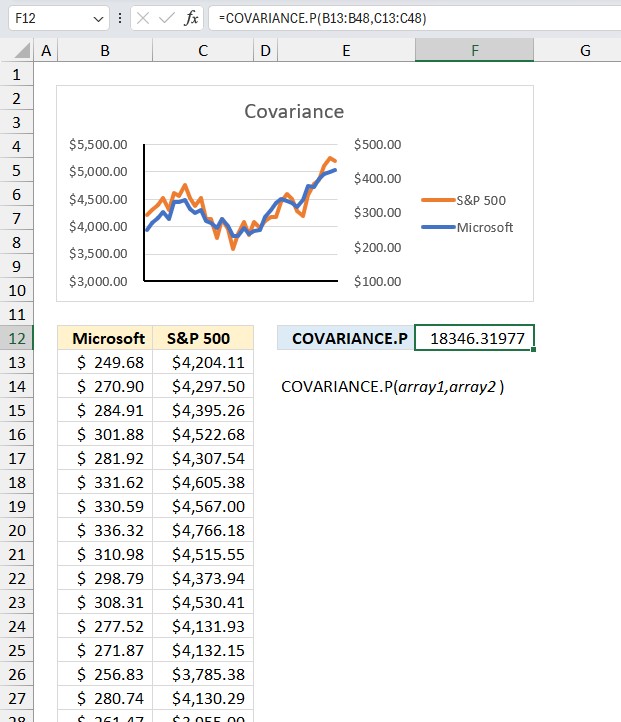
How to use the COVARIANCE.P function
What is the COVARIANCE.P function? The COVARIANCE.P function calculates the covariance in two different data sets. Table of Contents Introduction […]
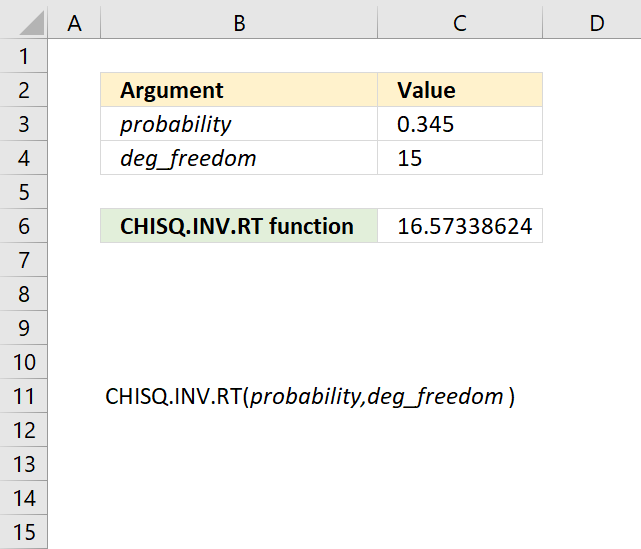
How to use the CHISQ.INV.RT function
What is the CHISQ.INV.RT function? The CHISQ.INV.RT function was introduced in Excel 2010 and calculates the inverse of the right-tailed […]
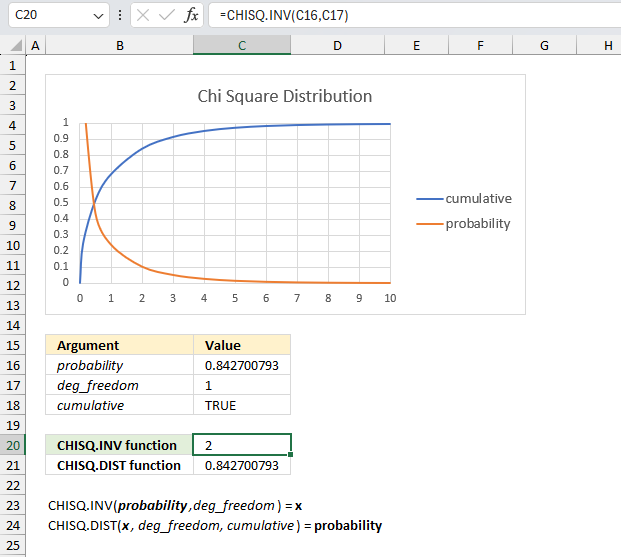
How to use the CHISQ.INV function
What is the CHISQ.INV function? The CHISQ.INV function was introduced in Excel 2010 and calculates the inverse of the left-tailed […]
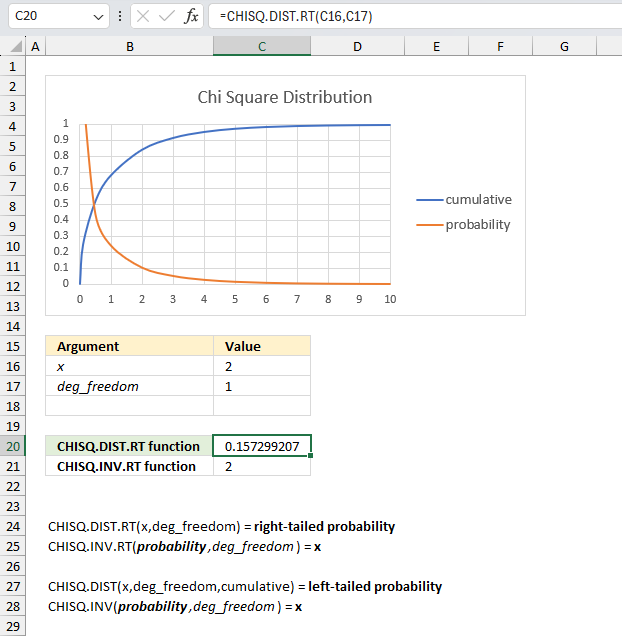
How to use the CHISQ.DIST.RT function
What is the CHISQ.DIST.RT function? The CHISQ.DIST.RT function was introduced in Excel 2010 and calculates the right-tailed probability of the chi-squared […]
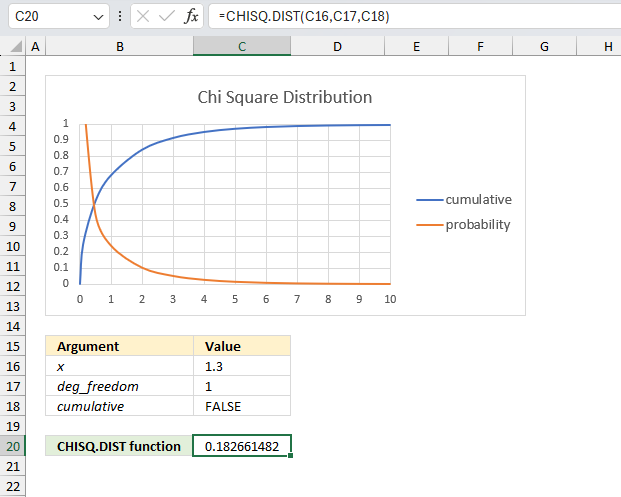
How to use the CHISQ.DIST function
What is the CHISQ.DIST function? The CHISQ.DIST function calculates the probability of the chi-squared distribution. Use this function to check […]
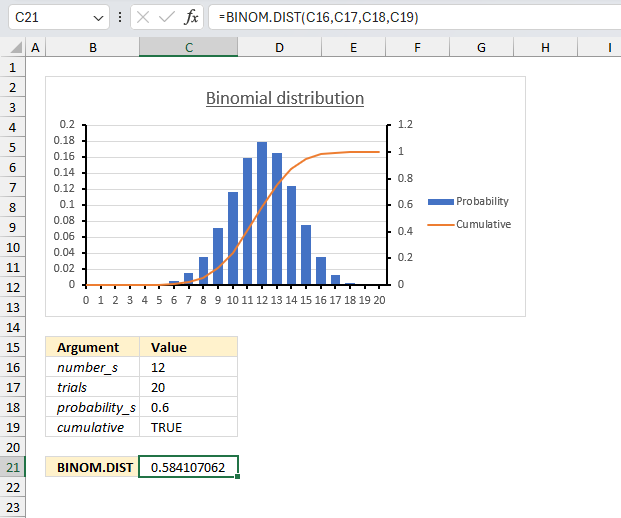
How to use the BINOM.DIST function
What is the BINOM.DIST function? The BINOM.DIST function calculates the individual term binomial distribution probability, use this function when the […]
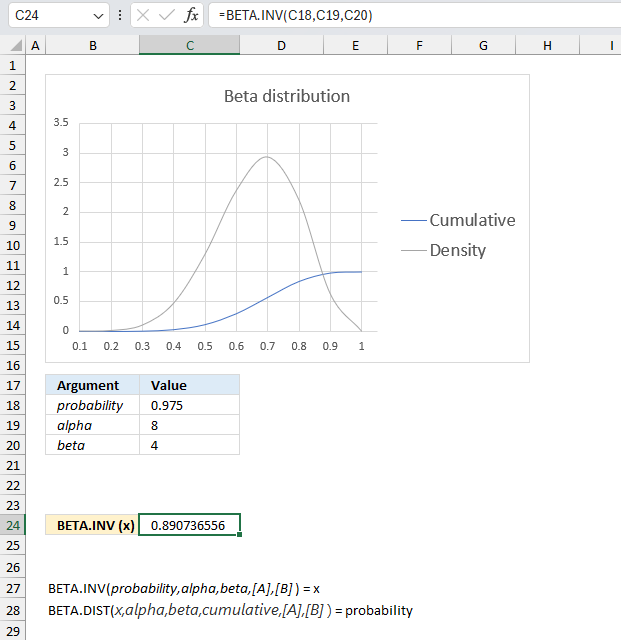
How to use the BETA.INV function
What is the BETA.INV function? The BETA.INV function calculates the inverse of the cumulative beta distribution. This function has replaced […]
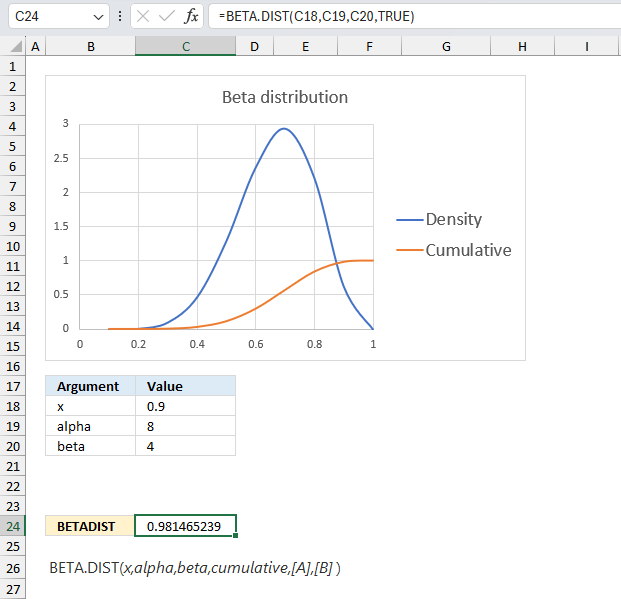
How to use the BETA.DIST function
What is the BETA.DIST function? The BETA.DIST function calculates the beta distribution. This function was introduced in Excel 2010. Table […]
How to use the RANK.EQ function
What is the RANK.EQ function? The RANK.EQ function calculates the rank of a number in a list of numbers, based […]
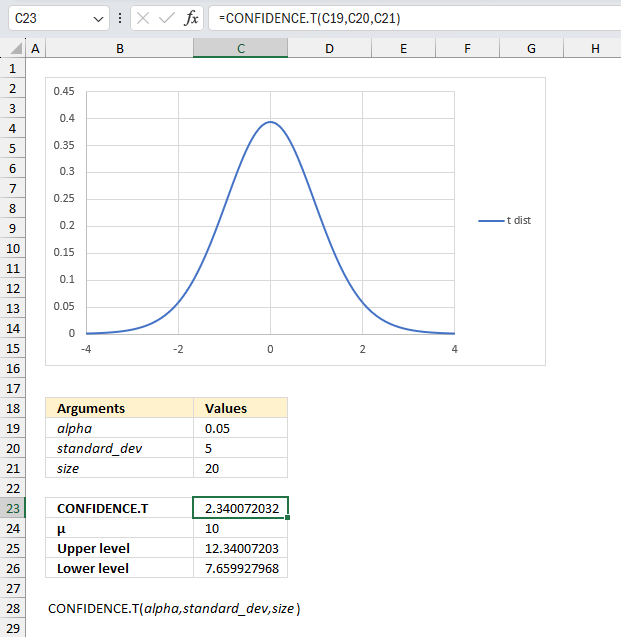
How to use the CONFIDENCE.T function
What is the CONFIDENCE.T function? The CONFIDENCE.T function calculates the confidence range for a population mean using a Student's t […]
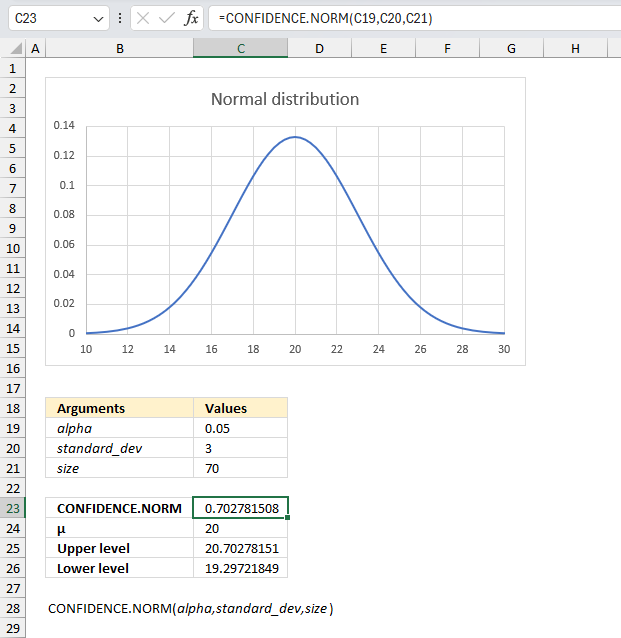
How to use the CONFIDENCE.NORM function
What is the CONFIDENCE.NORM function? The CONFIDENCE.NORM function calculates the confidence interval for a population mean. In other words it […]
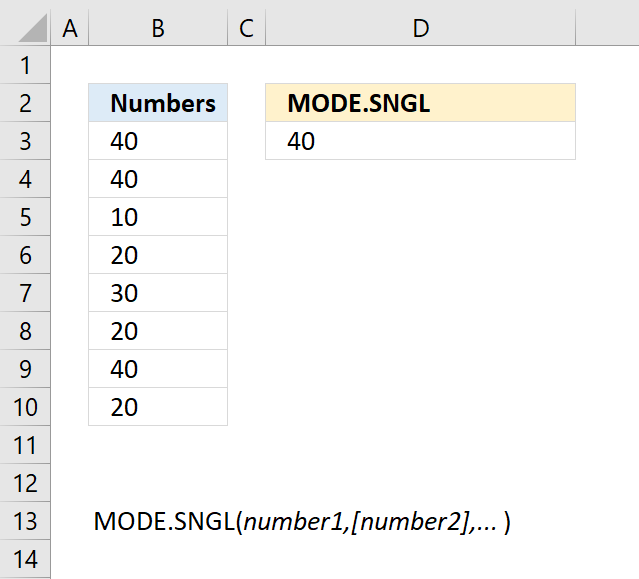
How to use the MODE.SNGL function
What is the MODE.SNGL function? The MODE.SNGL function calculates the most frequent number in an array or cell range. It […]
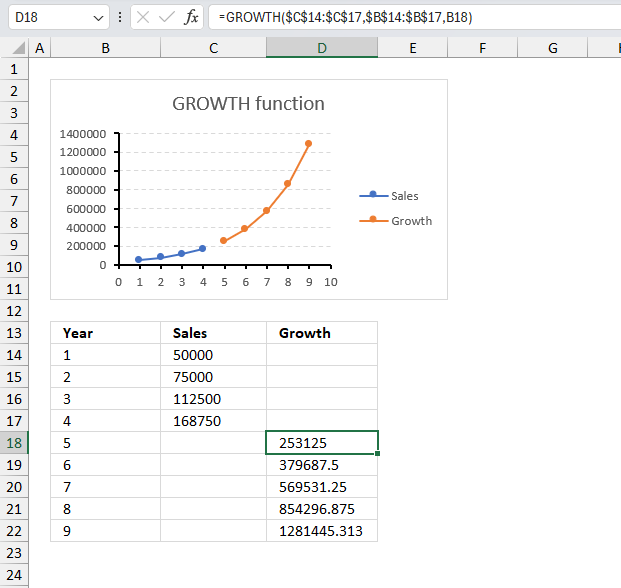
How to use the GROWTH function
What is the GROWTH function? The GROWTH function returns estimated exponential growth based on given data. It calculates the y-values […]
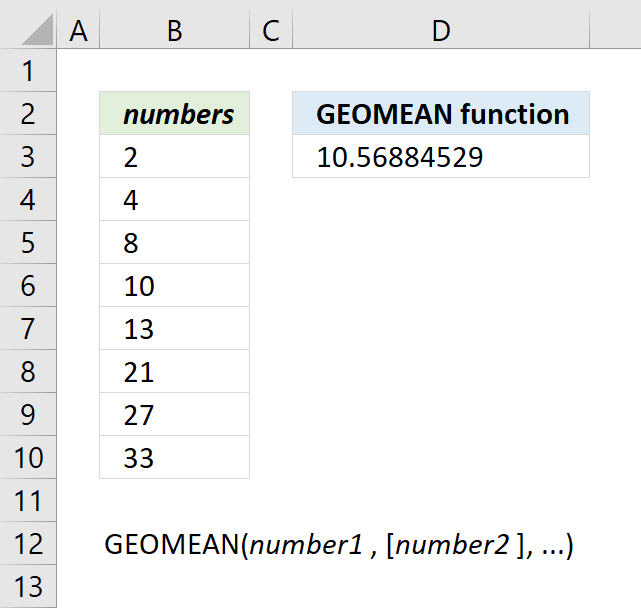
How to use the GEOMEAN function
What is the GEOMEAN function? The GEOMEAN function lets you calculate the geometric mean in Excel. The geometric mean is […]
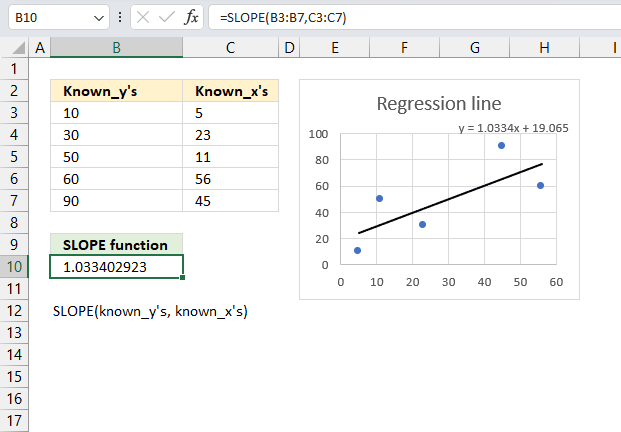
What is the SLOPE function? The SLOPE function calculates the slope of the linear regression line through coordinates. Table of […]
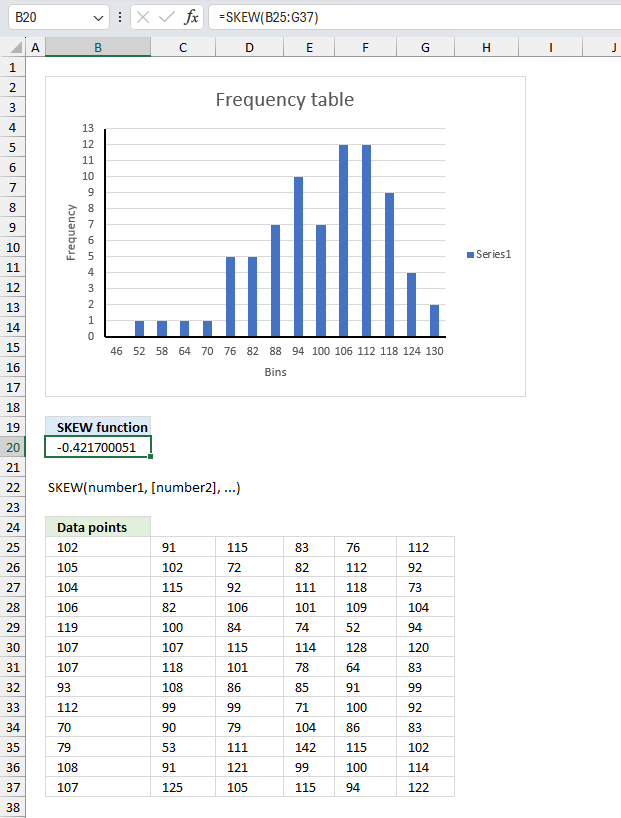
What is the SKEW function? The SKEW function calculates the skewness of a group of values with an asymmetric tail from […]
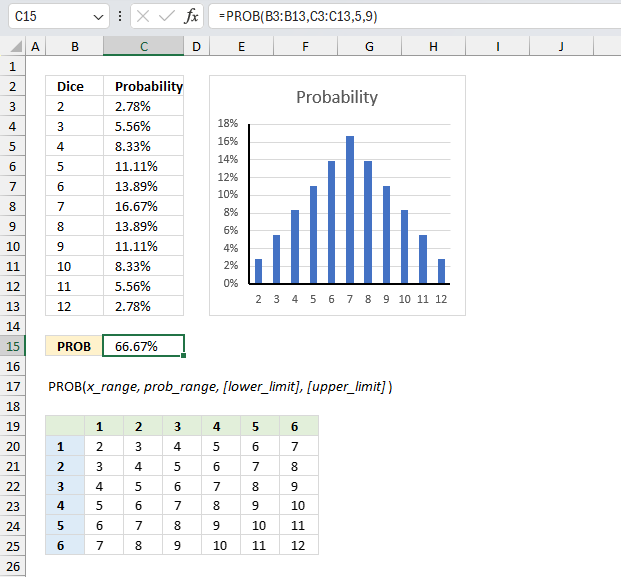
What is the PROB function? The PROB function calculates the probability that values in a range are between a given […]
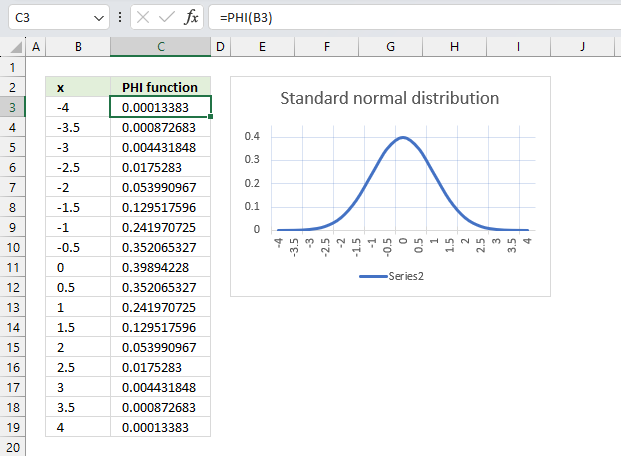
What is the PHI function? The PHI function calculates a number of the density function for a standard normal distribution. Table […]
How to use the MINIFS function
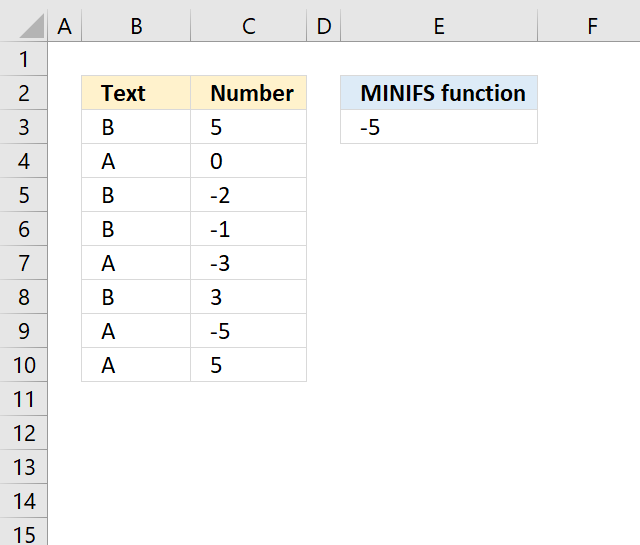
What is the MINIFS function? The MINIFS function calculates the smallest value based on a given set of criteria. Related […]
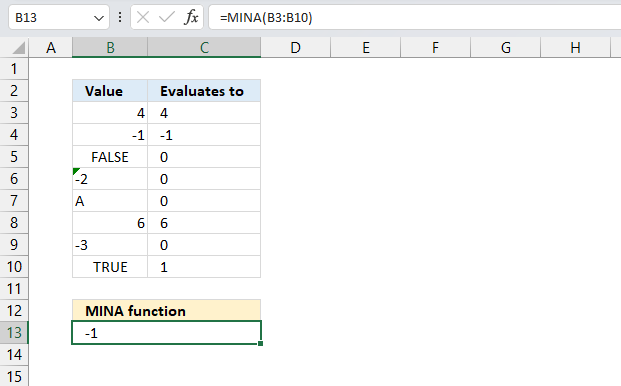
What is the MINA function? The MINA function returns the smallest number from an array or cell range. Blank cells […]
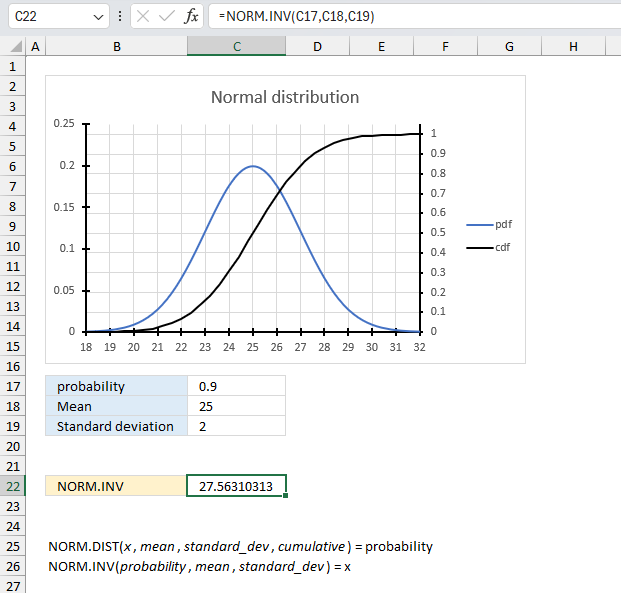
How to use the NORM.INV function
What is the NORM.INV function? The NORM.INV function calculates the inverse of the normal cumulative distribution for a given mean […]
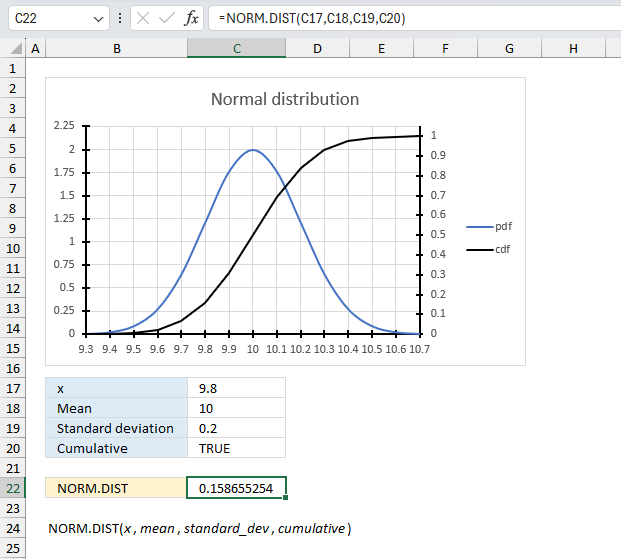
How to use the NORM.DIST function
What is the NORM.DIST function? The NORM.DIST function calculates the normal distribution for a given mean and standard deviation. Table […]
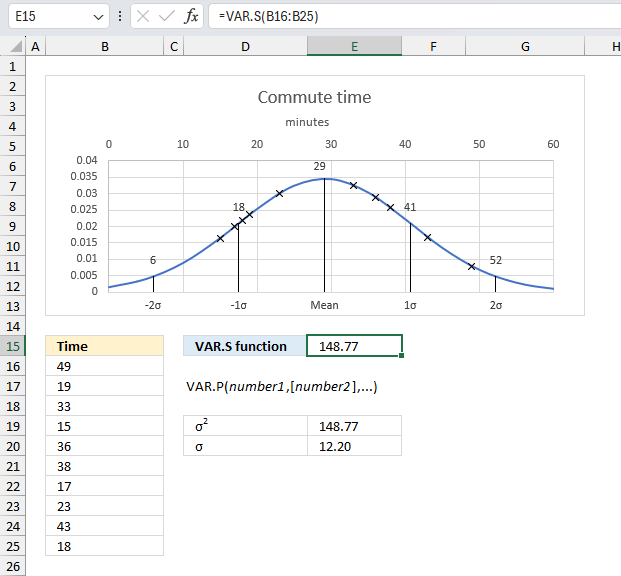
The VAR.S function tries to estimate the variance based on a sample of the population. The function ignores logical and […]
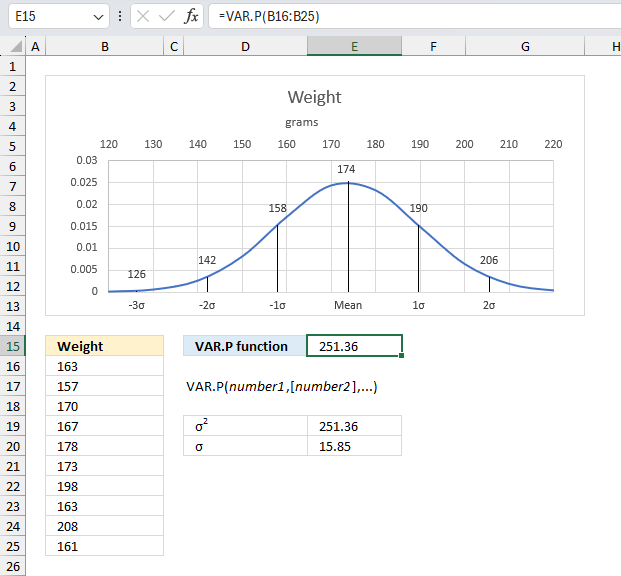
What is the VAR.P function? The VAR.P function returns the variance based on a population. The function ignores logical and […]
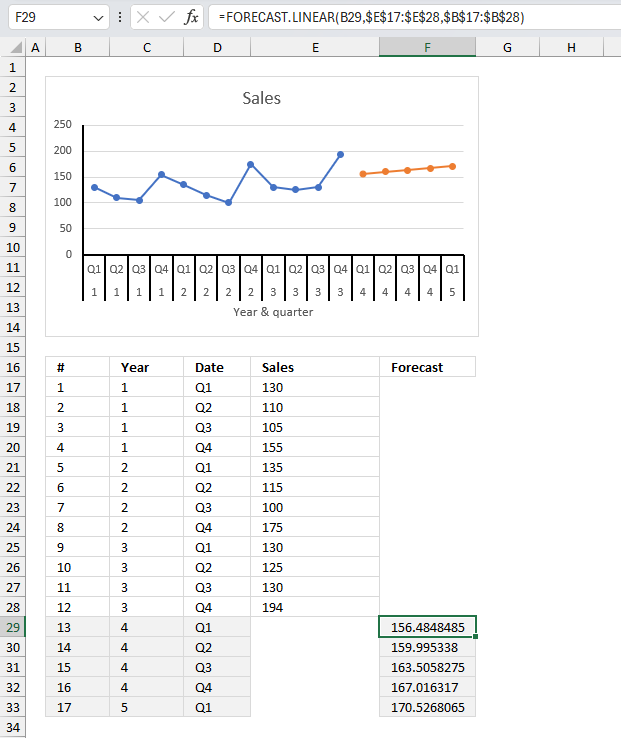
How to use the FORECAST.LINEAR function
What is the FORECAST.LINEAR function? The FORECAST.LINEAR function calculates a value based on existing x and y values using linear […]
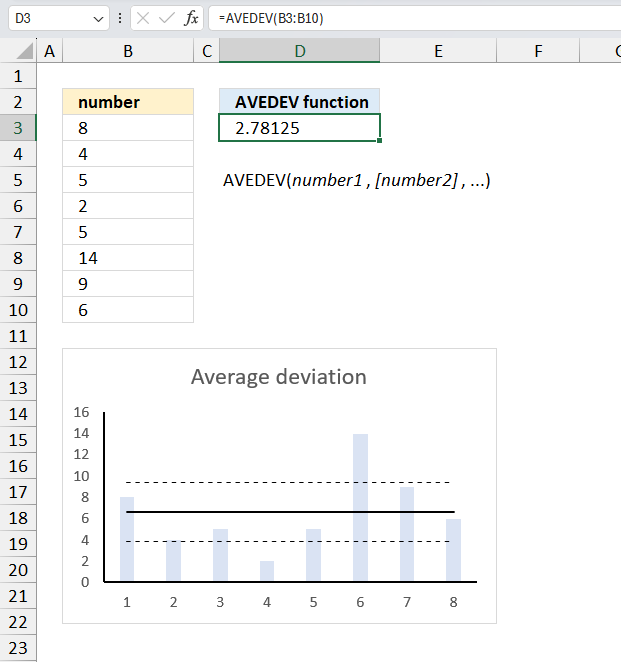
How to use the AVEDEV function
What is the AVEDEV function? The AVEDEV function calculates the average of the absolute deviations of data points from their […]
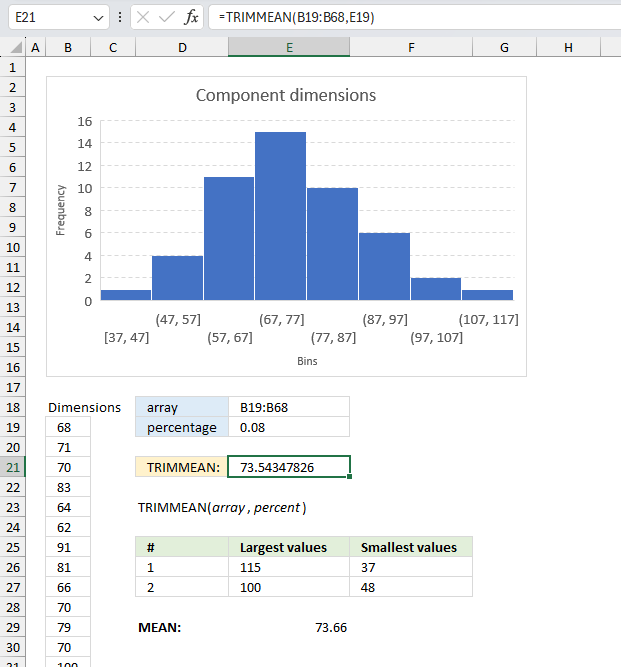
How to use the TRIMMEAN function
What is the TRIMMEAN function? The TRIMMEAN function calculates the mean of the interior of a data set. The function […]
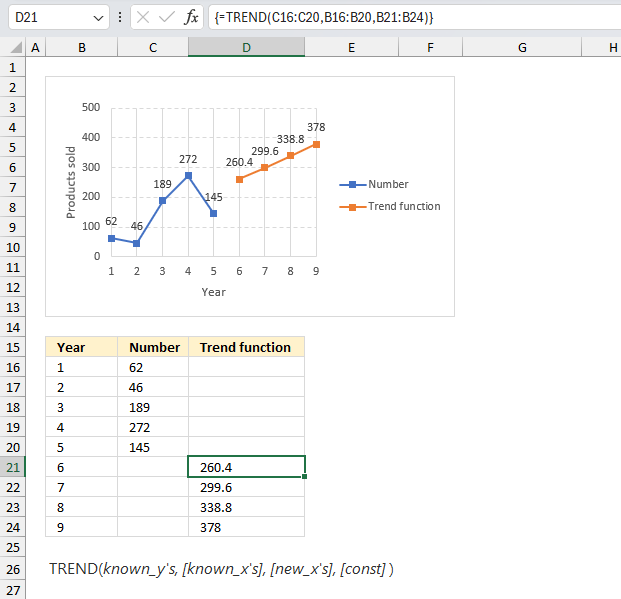
What is the TREND function? The TREND function calculates values along a linear trend. Fits a straight line (using the […]
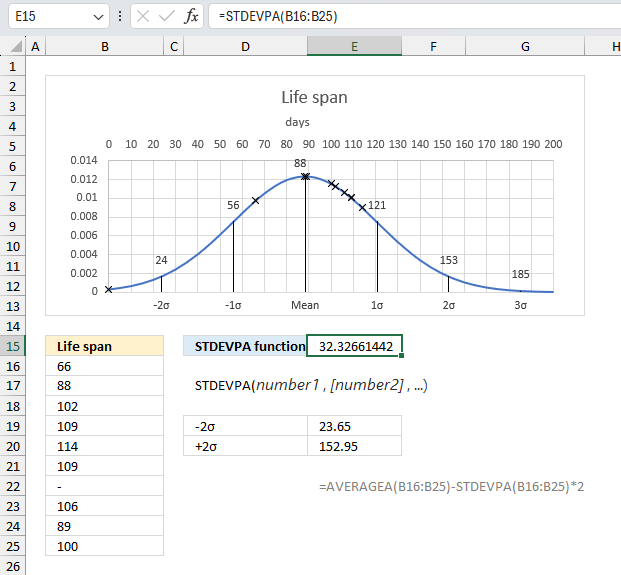
How to use the STDEVPA function
What is the STDEVPA function? The STDEVPA function returns the standard deviation based on the entire population. It evaluates Boolean […]
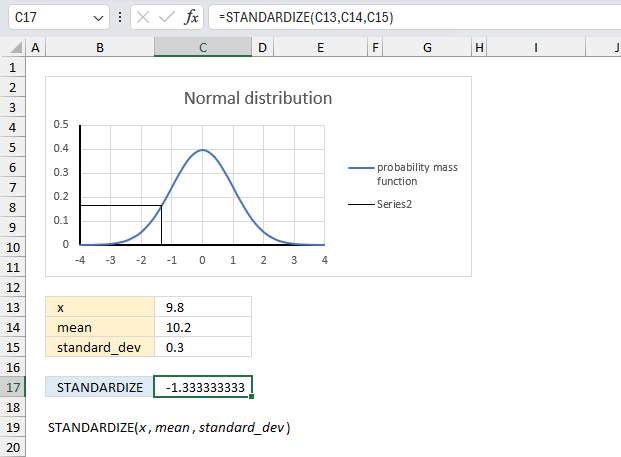
How to use the STANDARDIZE function
What is the STANDARDIZE function? The STANDARDIZE function calculates a normalized value from a distribution characterized by mean and standard_dev. […]
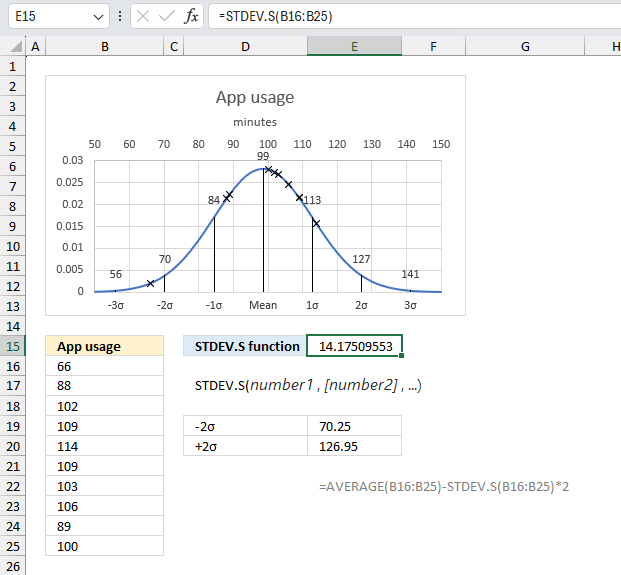
How to use the STDEV.S function
What is the STDEV.S function? The STDEV.S function returns standard deviation based on a sample of a population. Table of […]
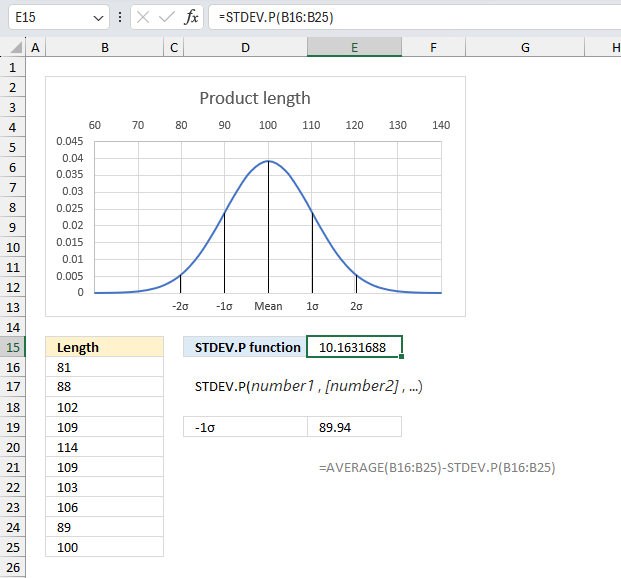
How to use the STDEV.P function
What is the STDEV.P function? The STDEV.P function returns standard deviation based on the entire population. STDEV.P is an abbreviation […]
How to use the RANK.AVG function
What is the RANK.AVG function? The RANK.AVG function returns the rank of a number in a list of numbers. The […]
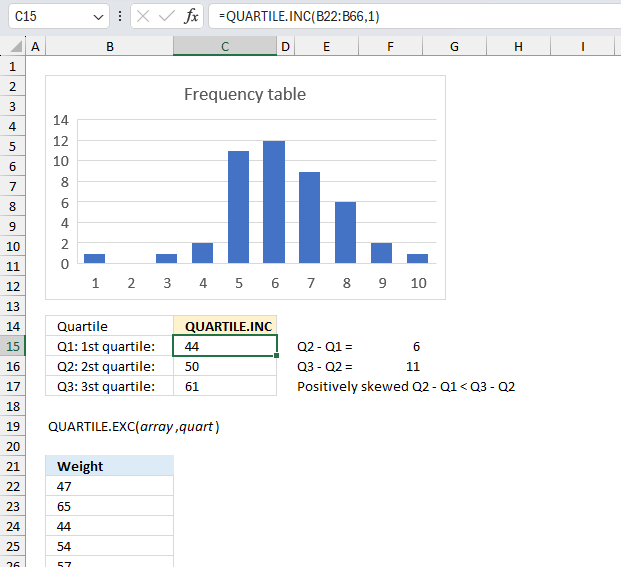
How to use the QUARTILE.INC function
What is the QUARTILE.INC function? The QUARTILE.INC function returns the quartile of a data set, based on percentile values from […]
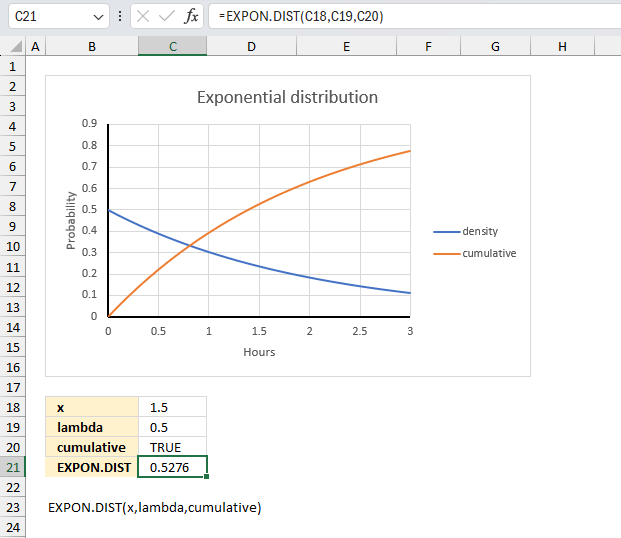
How to use the EXPON.DIST function
What is the EXPON.DIST function? The EXPON.DIST function calculates the exponential distribution representing an outcome in the form of probability. This […]
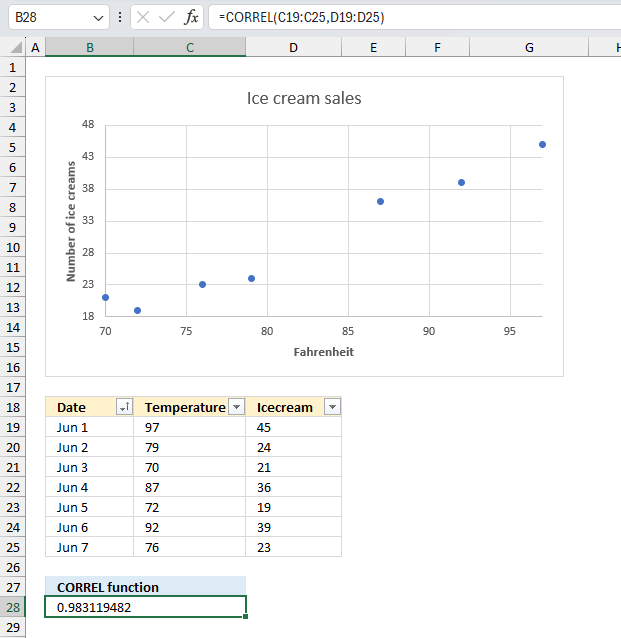
How to use the CORREL function
What is the CORREL function? The CORREL function calculates the correlation between two groups of numbers. Table of Contents Introduction Syntax […]
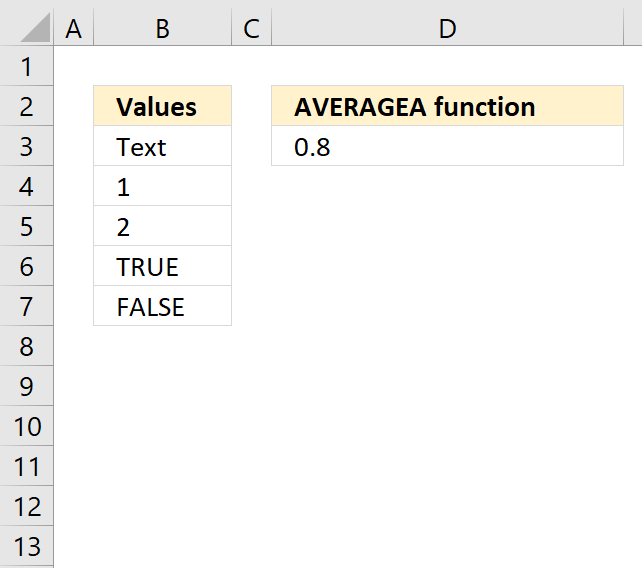
How to use the AVERAGEA function
What is the AVERAGEA function? The AVERAGEA function returns the average of a group of values. Text and boolean value […]
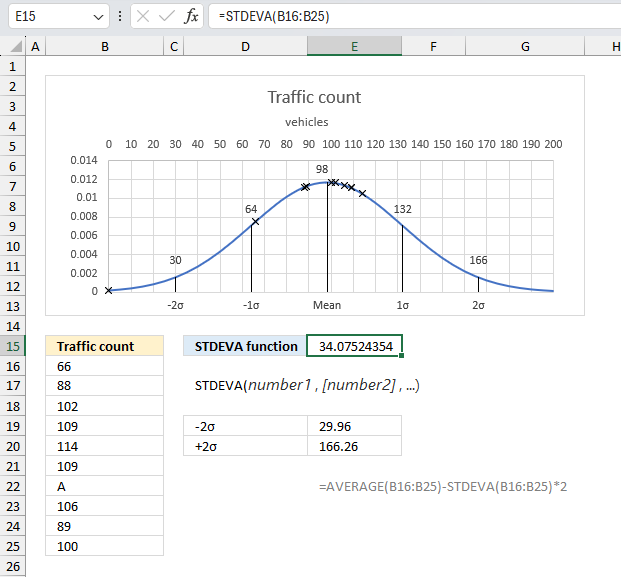
How to use the STDEVA function
The STDEVA function estimates the standard deviation from a sample of values. It evaluates Boolean value TRUE as 1, FALSE […]
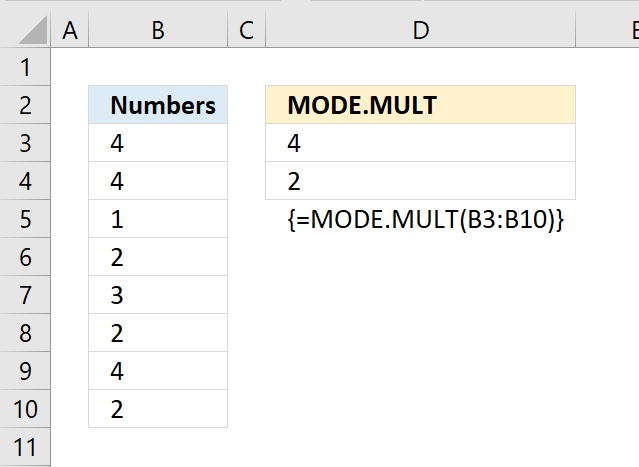
How to use the MODE.MULT function
What is the MODE.MULT function? The MODE.MULT function calculates the most frequent number in a cell range. It will return […]
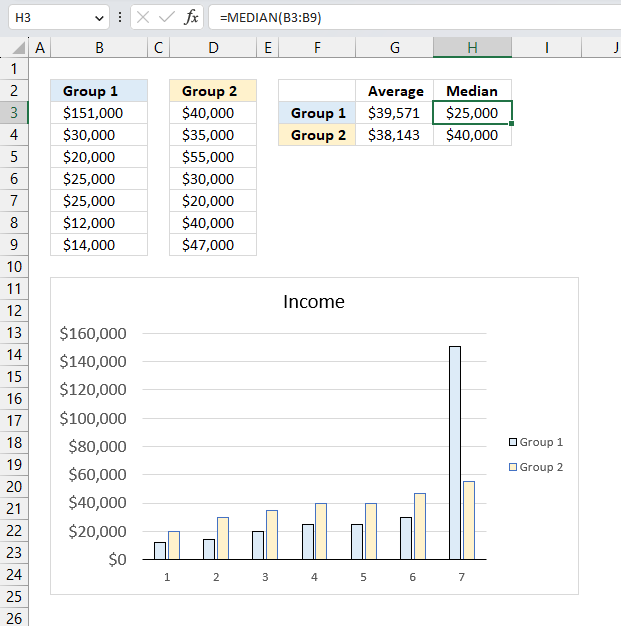
How to use the MEDIAN function
What is the MEDIAN function? The MEDIAN function calculates the median based on a set of numbers in Excel. The […]
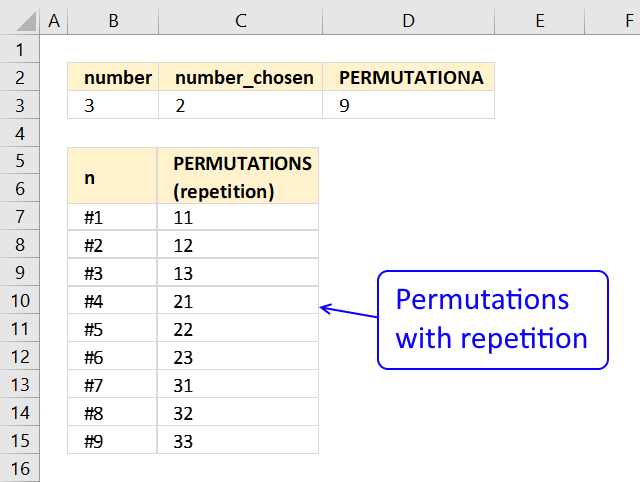
How to use the PERMUTATIONA function
What is the PERMUTATIONA function? The PERMUTATIONA function returns the number of permutations for a specific number of elements that […]
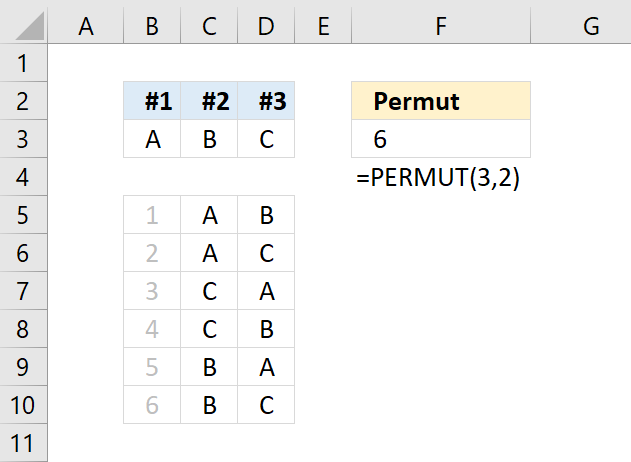
How to use the PERMUT function
The PERMUT function returns the number of permutations for a set of elements that can be selected from a larger […]
How to use the COUNTBLANK function
What is the COUNTBLANK Function? The COUNTBLANK function counts empty or blank cells in a range. Table of Contents Syntax […]
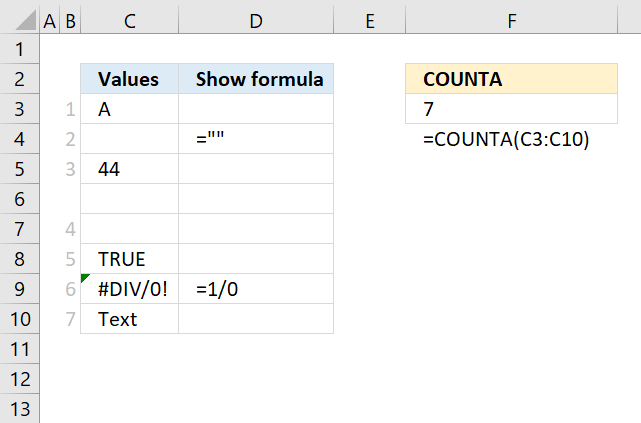
How to use the COUNTA function
What is the COUNTA function? The COUNTA function counts the non-empty or non-blank cells in a cell reference. Table of […]
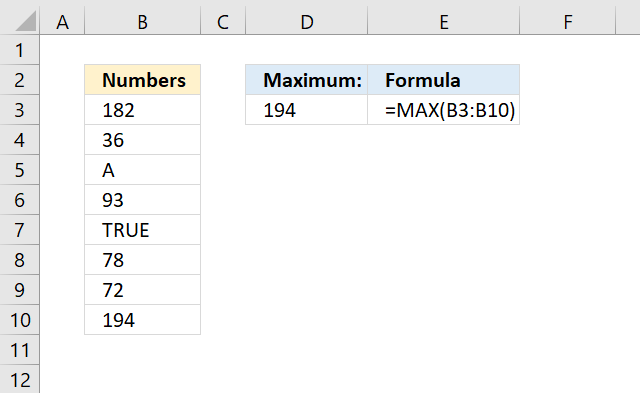
What is the MAX function? The MAX function calculates the largest number in a cell range or array. Table of […]
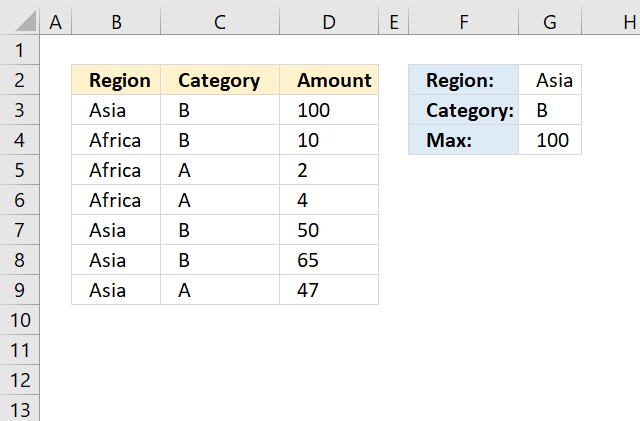
How to use the MAXIFS function
What is the MAXIFS function? The MAXIFS function returns the largest number based on a condition or criteria. The MAXIFS […]
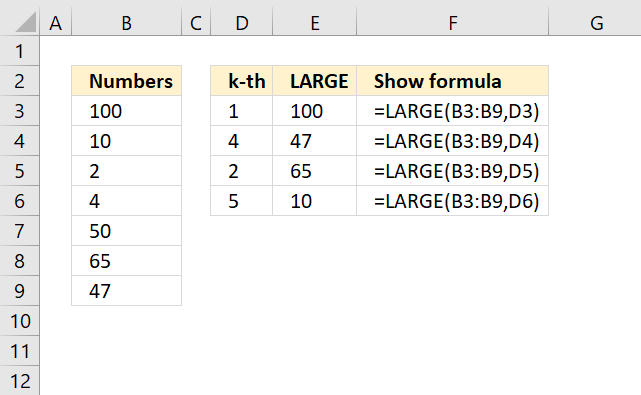
What is the LARGE function? The LARGE function calculates the k-th largest value from an array of numbers. Use the LARGE […]
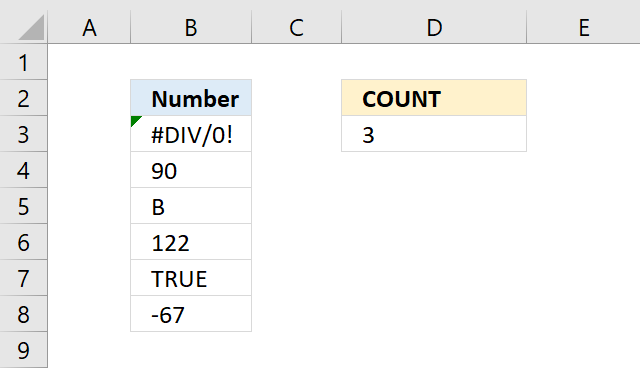
What is the COUNT function? The COUNT function counts all numerical values in an argument, it allows you to have […]
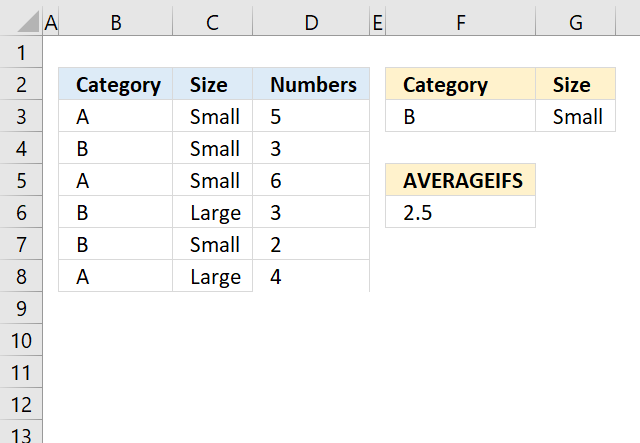
How to use the AVERAGEIFS function
What is the AVERAGEIFS function? The AVERAGEIFS function returns the average of cell values that evaluates to TRUE for multiple […]
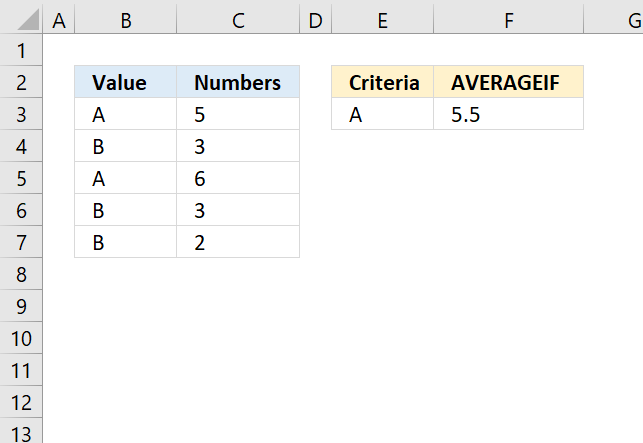
How to use the AVERAGEIF function
What is the AVERAGEIF function? The AVERAGEIF function returns the average of cell values that are valid for a given […]
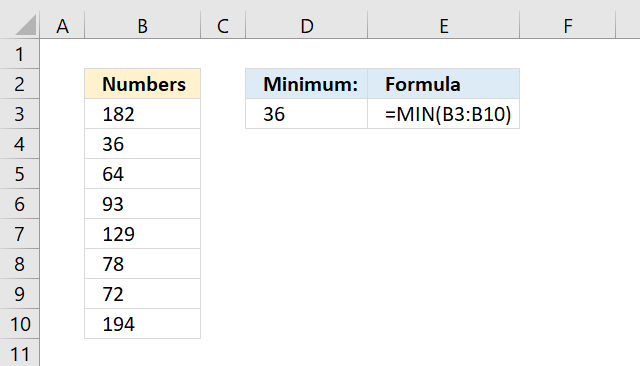
What is the MIN function? The MIN function allows you to retrieve the smallest number in a cell range. When […]
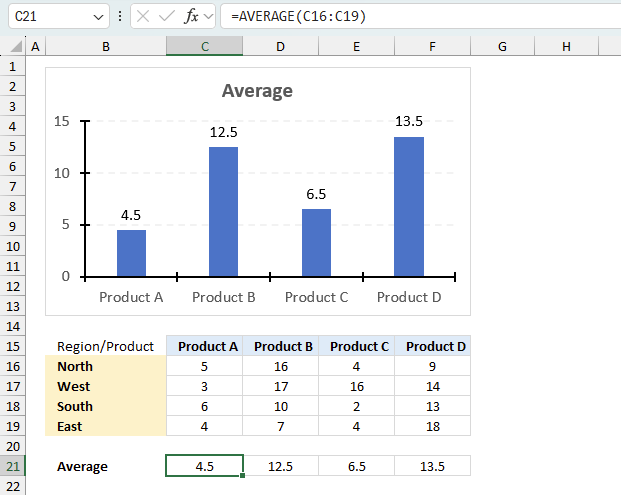
How to use the AVERAGE function
What is the AVERAGE function? The AVERAGE function calculates the average of numbers in a cell range. In other words, […]
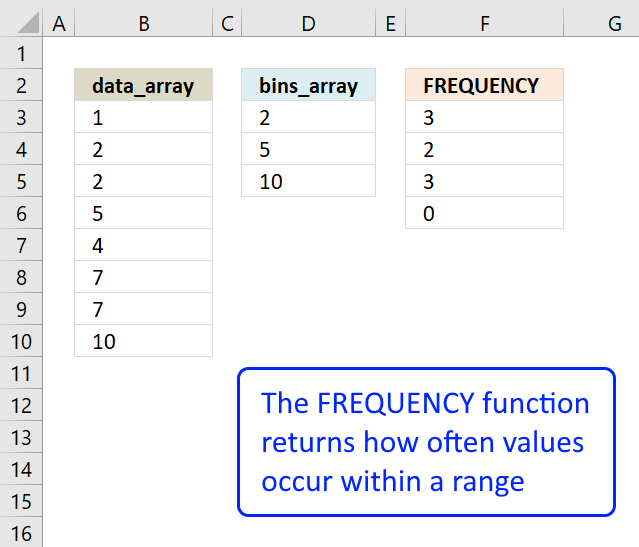
How to use the FREQUENCY function
Returns how many times values exist in a given range. Note, this function returns an array of values.
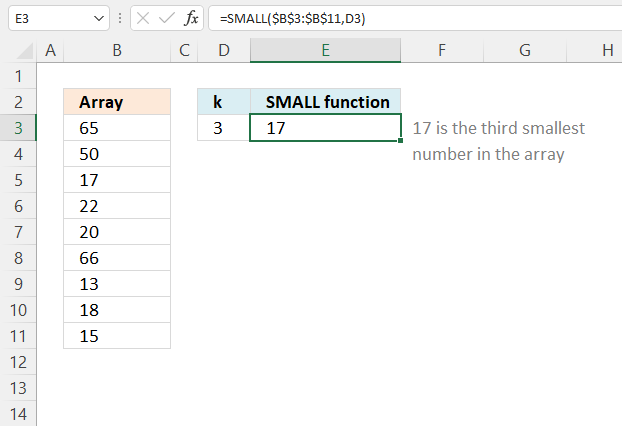
The SMALL function lets you extract a number in a cell range based on how small it is compared to the other numbers in the group.
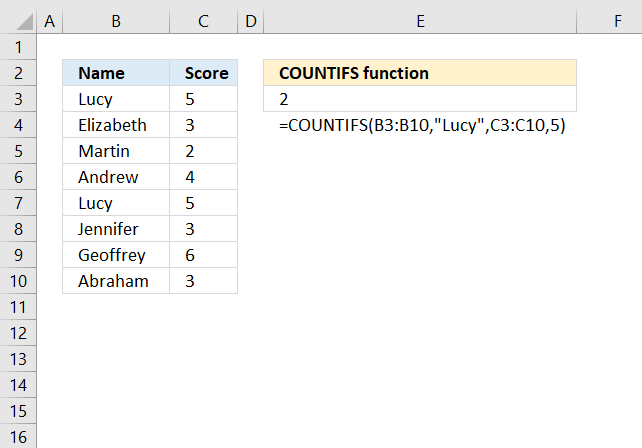
How to use the COUNTIFS function
Checks multiple conditions against the same number of cell ranges and counts how many times all criteria are met.
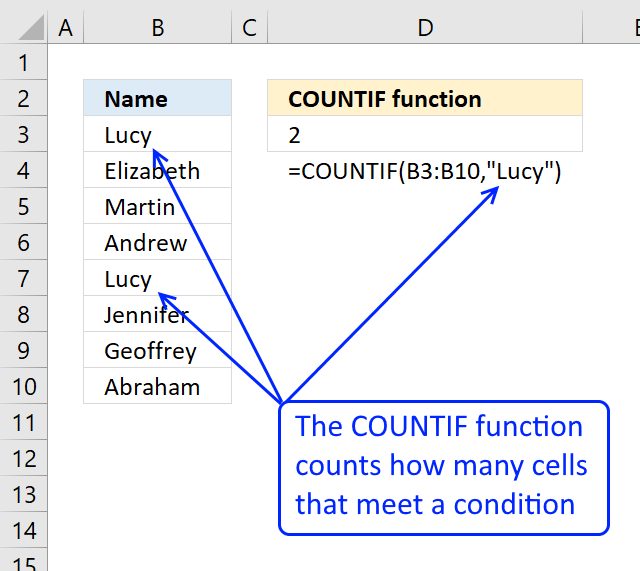
How to use the COUNTIF function
Counts the number of cells that meet a specific condition.