How to use the TREND function

What is the TREND function?
The TREND function calculates values along a linear trend. Fits a straight line (using the method of least squares) to the arrays known_y's and known_x's. It returns the y-values along that line for the array of new_x's that you specify.
In Excel versions prior to 365 the TREND function returns an array of values and the function must be entered as an array formula.
Table of Contents
1. Introduction
What is line fitting?
Line fitting is the process of fitting a straight line model to data in order to describe the linear relationship between two variables. The resulting line is called a regression line. The line of best fit minimizes the distance from all data points and allows predicting one variable from the other.
What is the method o least squares?
The method of least squares is a standard approach in regression analysis to find the best-fitting line or curve to a set of data points by minimizing the sum of the squares of the residuals.
What are residuals?
Residuals are the deviations of points from the fitted line/curve. Summing the squared residuals across all data points gives a measure of total error. The line/curve with the least sum of squared residuals provides the best fit. The resulting model fits the data well while being less sensitive to outliers.
What is a linear equation?
A linear equation is a type of equation that can be written in the form ax + b = 0, where a and b are constants and x is a variable. A linear equation represents a relationship between two quantities that are proportional to each other.
For example, if you have a linear equation that says y = 3x + 4, it means that for every unit increase in x, the value of y increases by 3 units and when x is zero y is 4.
The graph of a linear equation is always a straight line, a linear equation does not involve powers of variables.
What is the difference between the TREND function and the FORECAST.LINEAR?
FORECAST.LINEAR(x, known_y's, known_x's) has three arguments, all are required. The TREND(known_y's, [known_x's], [new_x's], [const]) has 4 arguments, one is required and 3 are optional.
You are required to enter the TREND function as an array formula if you use an Excel version prior to Excel 365.
2. Syntax
TREND(known_y's, [known_x's], [new_x's], [const])
3. Arguments
| nown_y's | Required. The set of y-values you already know in the relationship y = mx + b. |
| [known_x's] | Optional. An optional set of x-values that you may already know in the relationship y = mx + b. Default values are 1, 2, 3 ... |
| [new_x's] | Optional. New x-values for which you want TREND to return corresponding y-values. If you omit new_x's, it is assumed to be the same as known_x's. |
| [const] | Optional. A logical value specifying whether to force the constant b to equal 0. |
4. Example
Forecast the future demand for a product based on historical sales data and time periods.
The data in cell range B16:C20 is:
| Year | Number |
| 1 | 62 |
| 2 | 46 |
| 3 | 189 |
| 4 | 272 |
| 5 | 145 |
What is the forecast for year 6, 7, 8, and 9?
Formula in cell D21:
Excel 365 users may enter this formula as a regular formula, however, users with earlier Excel versions must enter this formula as an array formula- Follow the steps below.
How to enter the function as an array formula?
An array formula is a formula that returns multiple values. In versions earlier than Excel 365 you have to follow these steps:
- Double press with left mouse button on the cell where you want to enter the formula.
- Enter the function, for example: =TREND(C16:C20,B16:B20,B21:B24)
- Press and hold CTRL + SHIFT.
- Press Enter once.
- Release all keyboard keys.
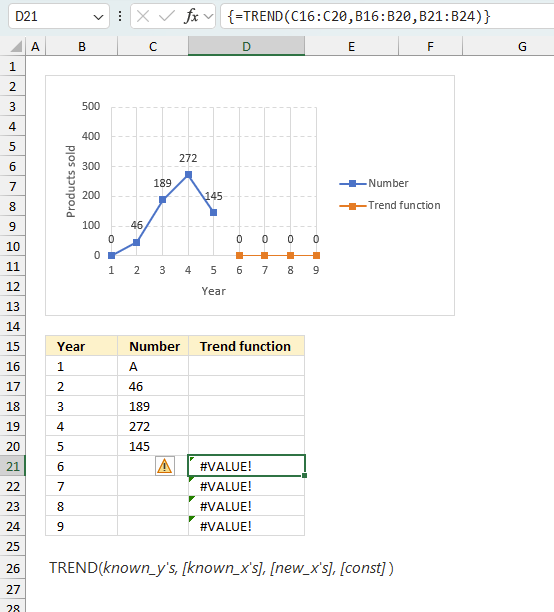
The formula is now enclosed with curly brackets, like this: {=TREND(C16:C20,B16:B20,B21:B24)} Don't enter these characters yourself, they appear automatically.
The curly brackets tell you that you successfully enter a formula as an array formula. The downside is that array formulas are easily broken when you edit the formula, you need to remember to repeat the steps above if you change the formula.
The good news is that Excel 365 simplified things a lot, you now enter regular and array formulas the same way simply by pressing the Enter key. Array formulas are now called dynamic array formulas meaning they automatically spill values to cells below and to the right as far as needed.
The formula returns:
| 6 | 260.4 | |
| 7 | 299.6 | |
| 8 | 338.8 | |
| 9 | 378 |
The image above shows the result in cells D21:D24. The image also shows a line chart, the blue line and blue markers display the known x's and y's. The orange line and markers show the predicted values for years 6, 7, 8, and 9.
5. What is the math behind the function?
The linear equation is as follows: y = mx + b
y - dependent variable
x - independent variable
m - slope
b - where the function intercepts the y axis
The formula we need to calculate the slope of regression line is:
m = Σ(x - x̄)(y - ȳ)/Σ(x - x̄)2
Σ - sum of
x̄ - sample mean
ȳ - sample mean
The formula we need to calculate the intercept of regression line, in other words, where the line intersects the y axis, is:
b = ȳ - mx̄
Y-intercept (c): c = ymean - m * xmean
Let's consider the following three pairs of x and y values:
(x1, y1) = (1, 3)
(x2, y2) = (2, 5)
(x3, y3) = (3, 7)
- Step 1: Calculate the means of x and y.
x̄ = (1 + 2 + 3) / 3 = 2
ȳ = (3 + 5 + 7) / 3 = 5 - Step 2: Calculate the sum of the products of the deviations and the sum of the squared deviations of x.
Σ(x - x̄)(y - ȳ) = (1 - 2)(3 - 5) + (2 - 2)(5 - 5) + (3 - 2)(7 - 5)
= (-1)(-2) + (0)(0) + (1)(2)
= 2 + 0 + 2
= 4
Σ(x - x̄)^2 = (1 - 2)^2 + (2 - 2)^2 + (3 - 2)^2
= 1 + 0 + 1
= 2 - Step 3: Calculate the slope (m) using the formula.
m = Σ(x - x̄)(y - ȳ) / Σ(x - x̄)^2
m = 4 / 2
m = 2
Step 4: Calculate the y-intercept (b) using the formula.
b = ȳ - mx̄
b = 5 - (2)(2)
b = 5 - 4
b = 1
Therefore, the equation of the regression line is: y = 2x + 1
This means that for every increase of 1 unit in x, the predicted value of y increases by 2 units, and when x is 0 the predicted value of y is 1. You can use this regression line equation to predict the value of y for any given value of x within the range of the data.
6. Function not working
The TREND function returns
- #VALUE! error if you use a non-numeric input value.
- #NAME? error if you misspell the function name.
- propagates errors, meaning that if the input contains an error (e.g., #VALUE!, #REF!), the function will return the same error.
6.1 Troubleshooting the error value
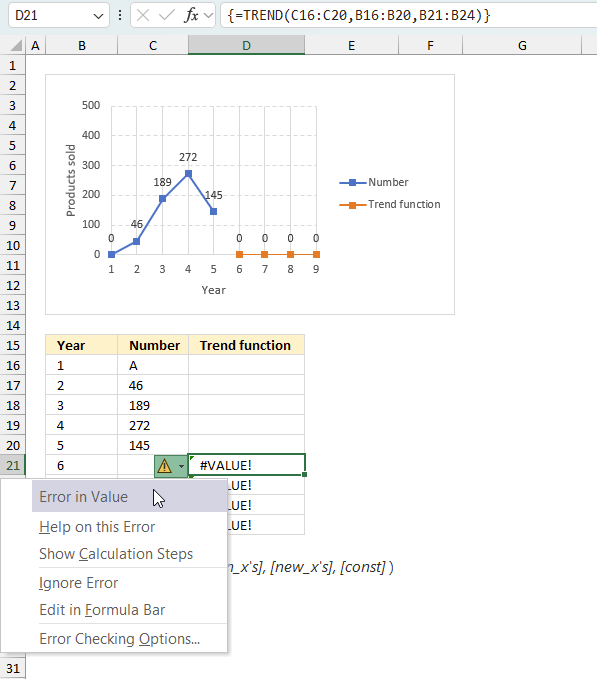
When you encounter an error value in a cell a warning symbol appears, displayed in the image above. Press with mouse on it to see a pop-up menu that lets you get more information about the error.
- The first line describes the error if you press with left mouse button on it.
- The second line opens a pane that explains the error in greater detail.
- The third line takes you to the "Evaluate Formula" tool, a dialog box appears allowing you to examine the formula in greater detail.
- This line lets you ignore the error value meaning the warning icon disappears, however, the error is still in the cell.
- The fifth line lets you edit the formula in the Formula bar.
- The sixth line opens the Excel settings so you can adjust the Error Checking Options.
Here are a few of the most common Excel errors you may encounter.
#NULL error - This error occurs most often if you by mistake use a space character in a formula where it shouldn't be. Excel interprets a space character as an intersection operator. If the ranges don't intersect an #NULL error is returned. The #NULL! error occurs when a formula attempts to calculate the intersection of two ranges that do not actually intersect. This can happen when the wrong range operator is used in the formula, or when the intersection operator (represented by a space character) is used between two ranges that do not overlap. To fix this error double check that the ranges referenced in the formula that use the intersection operator actually have cells in common.
#SPILL error - The #SPILL! error occurs only in version Excel 365 and is caused by a dynamic array being to large, meaning there are cells below and/or to the right that are not empty. This prevents the dynamic array formula expanding into new empty cells.
#DIV/0 error - This error happens if you try to divide a number by 0 (zero) or a value that equates to zero which is not possible mathematically.
#VALUE error - The #VALUE error occurs when a formula has a value that is of the wrong data type. Such as text where a number is expected or when dates are evaluated as text.
#REF error - The #REF error happens when a cell reference is invalid. This can happen if a cell is deleted that is referenced by a formula.
#NAME error - The #NAME error happens if you misspelled a function or a named range.
#NUM error - The #NUM error shows up when you try to use invalid numeric values in formulas, like square root of a negative number.
#N/A error - The #N/A error happens when a value is not available for a formula or found in a given cell range, for example in the VLOOKUP or MATCH functions.
#GETTING_DATA error - The #GETTING_DATA error shows while external sources are loading, this can indicate a delay in fetching the data or that the external source is unavailable right now.
6.2 The formula returns an unexpected value
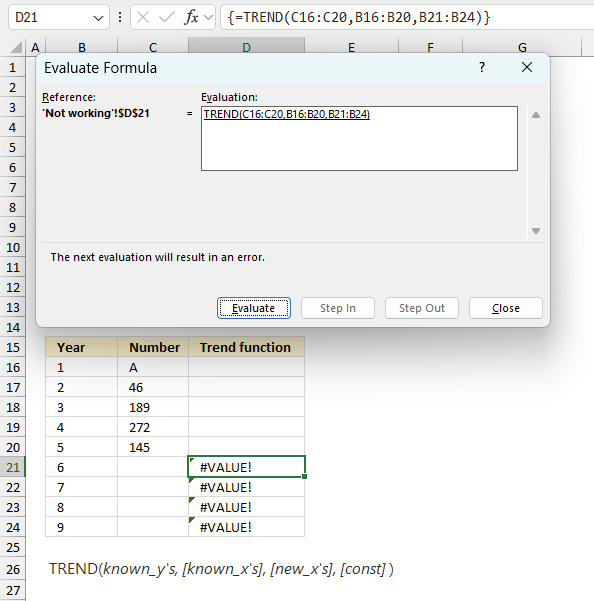
To understand why a formula returns an unexpected value we need to examine the calculations steps in detail. Luckily, Excel has a tool that is really handy in these situations. Here is how to troubleshoot a formula:
- Select the cell containing the formula you want to examine in detail.
- Go to tab “Formulas” on the ribbon.
- Press with left mouse button on "Evaluate Formula" button. A dialog box appears.
The formula appears in a white field inside the dialog box. Underlined expressions are calculations being processed in the next step. The italicized expression is the most recent result. The buttons at the bottom of the dialog box allows you to evaluate the formula in smaller calculations which you control. - Press with left mouse button on the "Evaluate" button located at the bottom of the dialog box to process the underlined expression.
- Repeat pressing the "Evaluate" button until you have seen all calculations step by step. This allows you to examine the formula in greater detail and hopefully find the culprit.
- Press "Close" button to dismiss the dialog box.
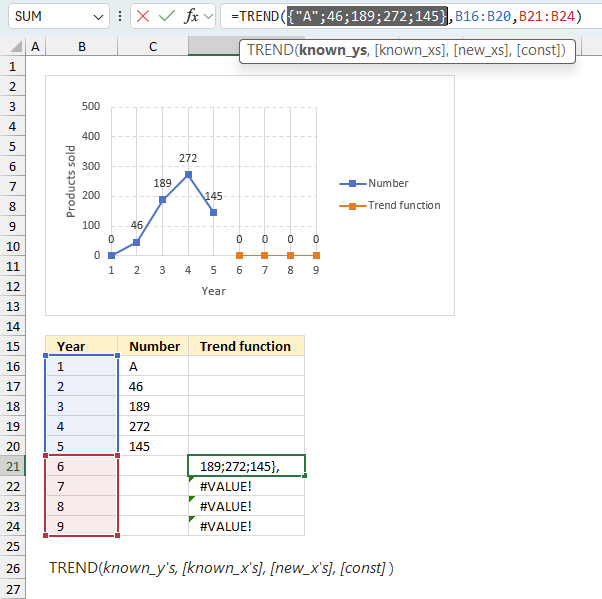
There is also another way to debug formulas using the function key F9. F9 is especially useful if you have a feeling that a specific part of the formula is the issue, this makes it faster than the "Evaluate Formula" tool since you don't need to go through all calculations to find the issue..
- Enter Edit mode: Double-press with left mouse button on the cell or press F2 to enter Edit mode for the formula.
- Select part of the formula: Highlight the specific part of the formula you want to evaluate. You can select and evaluate any part of the formula that could work as a standalone formula.
- Press F9: This will calculate and display the result of just that selected portion.
- Evaluate step-by-step: You can select and evaluate different parts of the formula to see intermediate results.
- Check for errors: This allows you to pinpoint which part of a complex formula may be causing an error.
The image above shows cell reference C16:C20 converted to hard-coded value using the F9 key. The TREND function requires numerical values which is not the case in this example. We have found what is wrong with the formula.
Tips!
- View actual values: Selecting a cell reference and pressing F9 will show the actual values in those cells.
- Exit safely: Press Esc to exit Edit mode without changing the formula. Don't press Enter, as that would replace the formula part with the calculated value.
- Full recalculation: Pressing F9 outside of Edit mode will recalculate all formulas in the workbook.
Remember to be careful not to accidentally overwrite parts of your formula when using F9. Always exit with Esc rather than Enter to preserve the original formula. However, if you make a mistake overwriting the formula it is not the end of the world. You can “undo” the action by pressing keyboard shortcut keys CTRL + z or pressing the “Undo” button
6.3 Other errors
Floating-point arithmetic may give inaccurate results in Excel - Article
Floating-point errors are usually very small, often beyond the 15th decimal place, and in most cases don't affect calculations significantly.
Functions in 'Statistical' category
The TREND function function is one of 73 functions in the 'Statistical' category.
How to comment
How to add a formula to your comment
<code>Insert your formula here.</code>
Convert less than and larger than signs
Use html character entities instead of less than and larger than signs.
< becomes < and > becomes >
How to add VBA code to your comment
[vb 1="vbnet" language=","]
Put your VBA code here.
[/vb]
How to add a picture to your comment:
Upload picture to postimage.org or imgur
Paste image link to your comment.
Contact Oscar
You can contact me through this contact form