How to use the SKEW function

What is the SKEW function?
The SKEW function calculates the skewness of a group of values with an asymmetric tail from its mean value.
Table of Contents
1. Introduction
What is skewness?
Skewness and asymmetric tails describe the lack of balance and symmetry in probability distributions and datasets. Identifying skewness is fundamental in statistics.
Skewness provides crucial information about the shape and symmetry of a distribution. A skewed distribution deviates from a perfectly symmetrical bell curve, indicating that the data is not evenly distributed around the mean or median.
Many statistical tests and analyses assume that the data follows a normal (Gaussian) distribution. Skewness is a key indicator of non-normality.
Skewness can be an indicator of outliers or extreme values in the data. Distributions with high skewness may be heavily influenced by a few extreme observations which can impact statistical analyses.
Skewness influences various descriptive statistics, such as the mean, median, and mode. In skewed distributions, the median may be a better measure of central tendency than the mean, which can be heavily influenced by extreme values.
Skewness is an important consideration when selecting appropriate probability distributions for modeling data. Many common distributions, such as the normal, lognormal, or exponential distributions, have specific skewness properties that need to be accounted for.
What is an asymmetric tail?
A symmetric distribution like the normal distribution has no skewness. An asymmetric tail is when one tail of the distribution extends further than the other.
What is the mean value?
The arithmetic mean is calculated by dividing the sum of all values by the number of values.
For example, an array contains these values: 3,2,1
The sum is 3 + 2 + 1 equals 6
The number of values is 3.
6/3 equals 2. The average of 3, 2, 1 is 2
What is a probability distribution?
A probability distribution lets you analyze how likely different random values occurs, in other words, it shows how often we would expect to see different potential values.
How to interpret the output from the SKEW function?
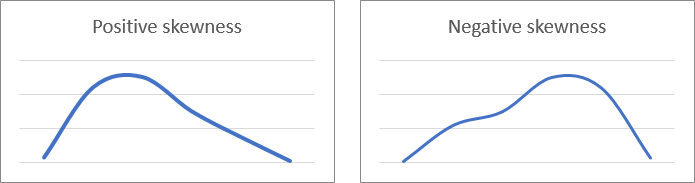
Positive skewness implies a group of values with an asymmetric tail moving toward more positive values. Negative skewness implies a group of values with an asymmetric tail moving toward more negative values.
Quartiles can also tell us about skewness
Symmetrical distribution: Q2- Q1 =Q3- Q2
Positively skewed: Q2- Q1 < Q3- Q2
Negatively skewed: Q2- Q1 > Q3- Q2
Learn more about quartiles: QUARTILE.INC | QUARTILE.EXC
Box plots can also tell us about skewness
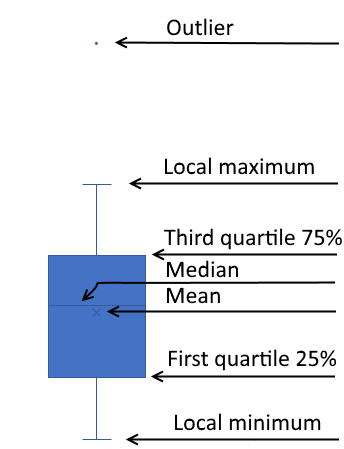
Q1 (first quartile) - 25th percentile
Q2 (second quartile) - 50th percentile (median)
Q3 (third quartile) - 75th percentile
Positively skewed if the median is closer to Q1 than Q3. Negatively skewed if the median is closer to Q3 than Q1.
2. Syntax
SKEW(number1, [number2], ...)
3. Arguments
| number1 | Required. This argument can be an array of constants or a cell reference to a group of values. |
| [number2] | Optional. Up to 254 additional arguments separated by commas. |
4. Example 1

A meteorologist is studying the distribution of daily rainfall measurements in a tropical region expecting lots of precipitation. They want to determine if the rainfall data is skewed, which could indicate the presence of extreme weather events or seasonal patterns. How can the SKEW function be used to assess the skewness of the rainfall data and potentially identify any deviations from a symmetric distribution?
The data points are:
| Data points | |||||
| 102 | 91 | 115 | 83 | 76 | 112 |
| 105 | 102 | 72 | 82 | 112 | 92 |
| 104 | 115 | 92 | 111 | 118 | 73 |
| 106 | 82 | 106 | 101 | 109 | 104 |
| 119 | 100 | 84 | 74 | 52 | 94 |
| 107 | 107 | 115 | 114 | 128 | 120 |
| 107 | 118 | 101 | 78 | 64 | 83 |
| 93 | 108 | 86 | 85 | 91 | 99 |
| 112 | 99 | 99 | 71 | 100 | 92 |
| 70 | 90 | 79 | 104 | 86 | 83 |
| 79 | 53 | 111 | 142 | 115 | 102 |
| 108 | 91 | 121 | 99 | 100 | 114 |
| 107 | 125 | 105 | 115 | 94 | 122 |
The argument is
- number1 = B25:G37
The SKEW function allows cell references to cell ranges, in this particular example on cell range containing 78 observations.
Formula in cell B20:
The formula returns approx. -0.42. A negative skew value means that the distribution has a longer tail on the left side.
5. Example 2

In an educational setting, teachers want to analyze the distribution of test scores for a particular subject. They suspect that the scores may be skewed due to the presence of a few exceptional students or potential grading issues. How can the SKEW function be applied to the test score data to identify and measure any skewness?
The scores are:
| Data points | |||||
| 35 | 60 | 47 | 36 | 71 | 28 |
| 22 | 74 | 56 | 58 | 83 | 49 |
| 94 | 76 | 80 | 89 | 46 | 82 |
| 67 | 7 | 44 | 62 | 92 | 37 |
| 55 | 54 | 15 | 66 | 30 | 17 |
| 31 | 36 | 61 | 45 | 56 | 16 |
| 46 | 43 | 32 | 83 | 12 | 50 |
| 44 | 78 | 70 | 29 | 25 | 52 |
| 55 | 81 | 63 | 46 | 30 | 21 |
| 47 | 31 | 39 | 40 | 46 | 22 |
| 66 | 34 | 42 | 65 | 59 | 60 |
| 74 | 30 | 30 | 78 | 35 | 34 |
| 65 | 9 | 32 | 37 | 89 | 21 |
The argument is
- number1 = B25:G37
The SKEW function allows cell references to cell ranges, in this particular example a cell range containing 78 observations.
Formula in cell B20:
The SKEW function returns a value of approximately 0.19. A positive skewness value indicates that the distribution has an elongated tail extending towards the right or higher values.
In other words, when the SKEW function returns a positive value, it suggests that the distribution of the data is skewed to the right or positively skewed. This means that the tail on the right side of the distribution is longer or more stretched out compared to the tail on the left side.
A positive skewness value indicates that there are more extreme values or outliers on the higher end of the distribution causing the tail to extend further to the right. The majority of the data points are concentrated towards the lower values with a smaller proportion of data points trailing off towards the higher values.
6. Example 3

In a study on household incomes, researchers want to analyze the distribution of incomes in a particular region. However, they suspect that the income data may be skewed due to the presence of a few extremely high or low incomes. How can the SKEW function be used to assess the degree of skewness in the income data?
The income data is located in cell range B25:G37
The argument is
- number1 = B25:G37
The SKEW function allows cell references to cell ranges, in this particular example a cell range containing 78 observations.
Formula in cell B20:
The SKEW function returns a value of approximately 0.003. A skewness value close to zero indicates that the distribution has symmetrical tails meaning the lengths of the tails on both sides of the distribution are roughly equal.
In other words, when the SKEW function returns a value very close to zero it suggests that the distribution of the data is approximately symmetric or bell-shaped. The tails on the positive and negative sides of the distribution extend to similar lengths without one tail being significantly longer or shorter than the other.
The closer the skewness value is to zero the more balanced and symmetrical the distribution is considered to be with the tails on both sides having roughly equal lengths or extensions. A skewness value of exactly zero would represent a perfectly symmetric distribution where the tails on both sides are identical in length and shape.
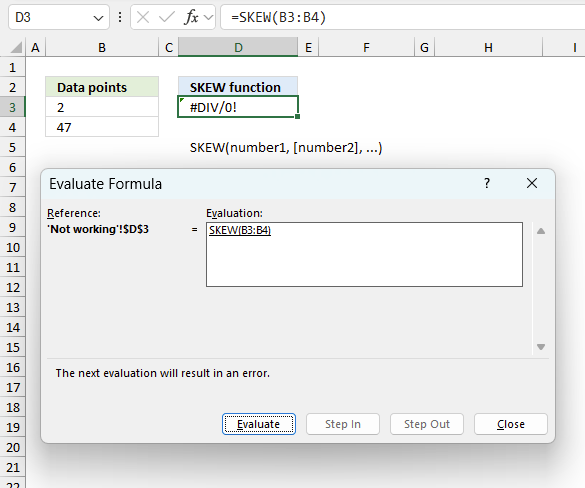
7. Function not working
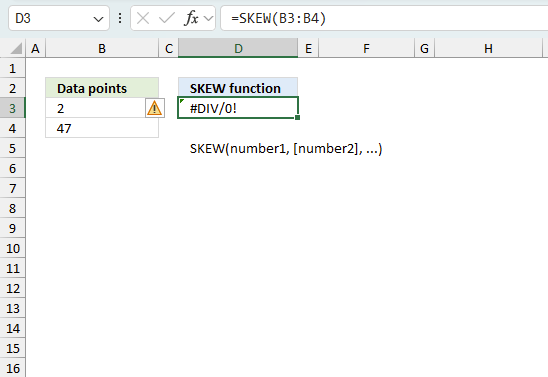
The SKEW function returns #DIV/0! error value if there are less than three numbers to be calculated.
7.1 Troubleshooting the error value
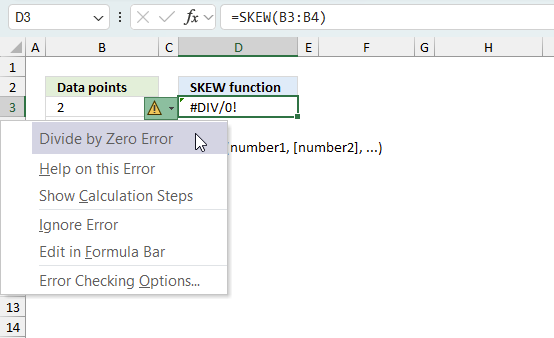
When you encounter an error value in a cell a warning symbol appears, displayed in the image above. Press with mouse on it to see a pop-up menu that lets you get more information about the error.
- The first line describes the error if you press with left mouse button on it.
- The second line opens a pane that explains the error in greater detail.
- The third line takes you to the "Evaluate Formula" tool, a dialog box appears allowing you to examine the formula in greater detail.
- This line lets you ignore the error value meaning the warning icon disappears, however, the error is still in the cell.
- The fifth line lets you edit the formula in the Formula bar.
- The sixth line opens the Excel settings so you can adjust the Error Checking Options.
Here are a few of the most common Excel errors you may encounter.
#NULL error - This error occurs most often if you by mistake use a space character in a formula where it shouldn't be. Excel interprets a space character as an intersection operator. If the ranges don't intersect an #NULL error is returned. The #NULL! error occurs when a formula attempts to calculate the intersection of two ranges that do not actually intersect. This can happen when the wrong range operator is used in the formula, or when the intersection operator (represented by a space character) is used between two ranges that do not overlap. To fix this error double check that the ranges referenced in the formula that use the intersection operator actually have cells in common.
#SPILL error - The #SPILL! error occurs only in version Excel 365 and is caused by a dynamic array being to large, meaning there are cells below and/or to the right that are not empty. This prevents the dynamic array formula expanding into new empty cells.
#DIV/0 error - This error happens if you try to divide a number by 0 (zero) or a value that equates to zero which is not possible mathematically.
#VALUE error - The #VALUE error occurs when a formula has a value that is of the wrong data type. Such as text where a number is expected or when dates are evaluated as text.
#REF error - The #REF error happens when a cell reference is invalid. This can happen if a cell is deleted that is referenced by a formula.
#NAME error - The #NAME error happens if you misspelled a function or a named range.
#NUM error - The #NUM error shows up when you try to use invalid numeric values in formulas, like square root of a negative number.
#N/A error - The #N/A error happens when a value is not available for a formula or found in a given cell range, for example in the VLOOKUP or MATCH functions.
#GETTING_DATA error - The #GETTING_DATA error shows while external sources are loading, this can indicate a delay in fetching the data or that the external source is unavailable right now.
7.2 The formula returns an unexpected value
To understand why a formula returns an unexpected value we need to examine the calculations steps in detail. Luckily, Excel has a tool that is really handy in these situations. Here is how to troubleshoot a formula:
- Select the cell containing the formula you want to examine in detail.
- Go to tab “Formulas” on the ribbon.
- Press with left mouse button on "Evaluate Formula" button. A dialog box appears.
The formula appears in a white field inside the dialog box. Underlined expressions are calculations being processed in the next step. The italicized expression is the most recent result. The buttons at the bottom of the dialog box allows you to evaluate the formula in smaller calculations which you control. - Press with left mouse button on the "Evaluate" button located at the bottom of the dialog box to process the underlined expression.
- Repeat pressing the "Evaluate" button until you have seen all calculations step by step. This allows you to examine the formula in greater detail and hopefully find the culprit.
- Press "Close" button to dismiss the dialog box.
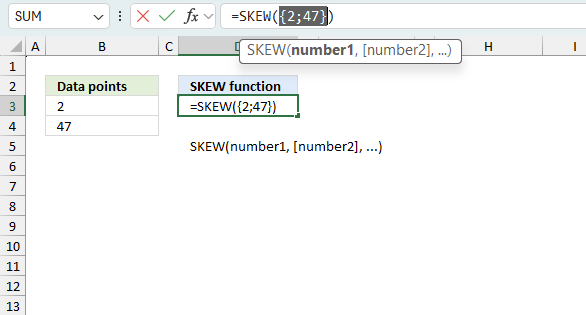
There is also another way to debug formulas using the function key F9. F9 is especially useful if you have a feeling that a specific part of the formula is the issue, this makes it faster than the "Evaluate Formula" tool since you don't need to go through all calculations to find the issue..
- Enter Edit mode: Double-press with left mouse button on the cell or press F2 to enter Edit mode for the formula.
- Select part of the formula: Highlight the specific part of the formula you want to evaluate. You can select and evaluate any part of the formula that could work as a standalone formula.
- Press F9: This will calculate and display the result of just that selected portion.
- Evaluate step-by-step: You can select and evaluate different parts of the formula to see intermediate results.
- Check for errors: This allows you to pinpoint which part of a complex formula may be causing an error.
The image above shows cell reference B3:B4 converted to hard-coded value using the F9 key. The SKEW function requires more than two numerical values which is not the case in this example. We have found what is wrong with the formula.
Tips!
- View actual values: Selecting a cell reference and pressing F9 will show the actual values in those cells.
- Exit safely: Press Esc to exit Edit mode without changing the formula. Don't press Enter, as that would replace the formula part with the calculated value.
- Full recalculation: Pressing F9 outside of Edit mode will recalculate all formulas in the workbook.
Remember to be careful not to accidentally overwrite parts of your formula when using F9. Always exit with Esc rather than Enter to preserve the original formula. However, if you make a mistake overwriting the formula it is not the end of the world. You can “undo” the action by pressing keyboard shortcut keys CTRL + z or pressing the “Undo” button
7.3 Other errors
Floating-point arithmetic may give inaccurate results in Excel - Article
Floating-point errors are usually very small, often beyond the 15th decimal place, and in most cases don't affect calculations significantly.
8. How is the function calculated?
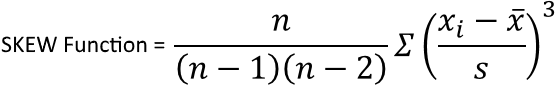
SKEW function = n/(n-1)(n-2)Σ(xi - x̄/s)3
n - number of data points
xi - data point
x̄ - arithmetic mean
s - standard deviation
What is the standard deviation?

Standard deviation tells you how far from the average values are spread out. Both charts above have numbers and an average plotted, they share the same average however, the numbers are not the same.
Chart A above shows that the values are more spread out than the values in chart B. Chart A has a standard deviation of 23.45256334, standard deviation for chart B is 5.207075606. Standard deviation is used in statistics.

√(Σ(x - x̄)2/n)
x̄̅ is the average.
n is how many values.
Functions in 'Statistical' category
The SKEW function function is one of 73 functions in the 'Statistical' category.
How to comment
How to add a formula to your comment
<code>Insert your formula here.</code>
Convert less than and larger than signs
Use html character entities instead of less than and larger than signs.
< becomes < and > becomes >
How to add VBA code to your comment
[vb 1="vbnet" language=","]
Put your VBA code here.
[/vb]
How to add a picture to your comment:
Upload picture to postimage.org or imgur
Paste image link to your comment.
Contact Oscar
You can contact me through this contact form