How to use the MODE.SNGL function
What is the MODE.SNGL function?
The MODE.SNGL function calculates the most frequent number in an array or cell range.
It returns only one value even if there are two or more equally frequent values.
Can the MODE.SNGL function extract multiple mode values?
No, use the MODE.MULT function to extract multiple mode values if they are equally frequent.
Can the MODE.SNGL function extract the most common text value?
No, text, boolean values, and empty cells are ignored. There is a workaround, see section 5 below.
How to test if a distribution has multiple modes?
Table of Contents
1. MODE.SNGL Function Syntax
MODE.SNGL(number1,[number2],...)
2. MODE.SNGL Function Arguments
| number1 | Required. A number or cell reference for which you want to calculate the MODE.SNGL for. |
| [number2] | Optional. Up to 254 additional arguments. |
3. MODE.SNGL Function Example
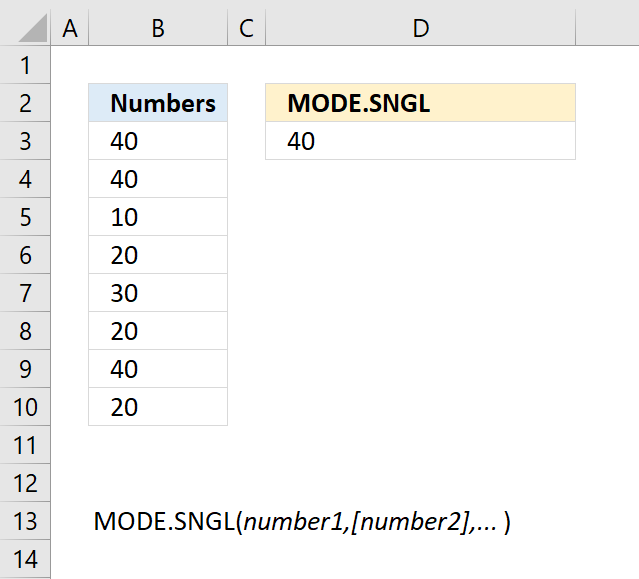
The image above demonstrates the MODE.SNGL function. It extracts the most frequent number from cell range B3:B10. That is 40 in this example, it exists three times and is the most repeated number.
Formula in cell D3:
This function is entered as a regular function, it returns only one value.
How to create a frequency table based on numerical values
How to create a frequency table based on text values
4. MODE.SNGL not working

MODE.SNGL function returns #N/A error value if the source data set contains no duplicates.

It also returns an error if the source data contains an error, you can handle this by using the IFERROR function and convert errors to text values that the function then ignores. The data in cell range B3:B10, displayed in the image above, is:
| Numbers |
| 40 |
| 40 |
| 10 |
| #DIV/0! |
| 30 |
| 20 |
| 40 |
| 20 |
Here is an example that removes error values and converts them to blank values "".
This formula ignores the error value and returns 40 which is the most frequent number in B3:B10.
5. Extract the most frequent text value - MODE.SNGL function

The MODE.SNGL calculates the most frequent number, it ignores text and boolean values. This example demonstrates a formula that extracts the most frequent text value in a given cell range.
The formula in cell D3 extracts the most frequent text value from cell range B3:B16. It will only return a single value even if there are multiple mode values that are equally frequent.
How to test if a distribution has multiple modes?
Cell range B3:B16 contains student grades from A to E, cells D3 and D4 contain grade "D" and "C". They are equally frequent in B3:B16.
Excel 365 formula in cell D3:
If you need to extract multiple mode text values, read this:
Extract the most frequent text values
Explaining formula
Step 1 - Find relative position in the array
The MATCH function returns the relative position of an item in an array that matches a specified value in a specific order.
Function syntax: MATCH(lookup_value, lookup_array, [match_type])
MATCH(B3:B16,B3:B16,0)
becomes
MATCH({"D";"E";"C";"D";"A";"E";"D";"B";"D";"C";"B";"D";"C";"B"},{"D";"E";"C";"D";"A";"E";"D";"B";"D";"C";"B";"D";"C";"B"},0)
and returns
{1;2;3;1;5;2;1;8;1;3;8;1;3;8}.
Step 2 - Calculate the mode
The MODE.SNGL function calculates the most frequent value in an array or range of data.
Function syntax: MODE.SNGL(number1,[number2],...)
MODE.SNGL(MATCH(B3:B16,B3:B16,0))
becomes
MODE.SNGL({1;2;3;1;5;2;1;8;1;3;8;1;3;8})
and returns 1.
Step 3 - Find the position of the mode numbers in the array
The MATCH function returns the relative position of an item in an array that matches a specified value in a specific order.
Function syntax: MATCH(lookup_value, lookup_array, [match_type])
MATCH(MODE.SNGL(MATCH(B3:B16,B3:B16,0)),MATCH(B3:B16,B3:B16,0),0)
becomes
MATCH(1,{1;2;3;1;5;2;1;8;1;3;8;1;3;8},0)
and returns 1.
Step 4 - Get text values from the corresponding positions
The INDEX function returns a value or reference from a cell range or array, you specify which value based on a row and column number.
Function syntax: INDEX(array, [row_num], [column_num])
INDEX(B3:B16,MATCH(MODE.SNGL(MATCH(B3:B16,B3:B16,0)),MATCH(B3:B16,B3:B16,0),0))
becomes
INDEX(B3:B16,1)
and returns "D".
Step 5 - Shorten formula
The LET function lets you name intermediate calculation results which can shorten formulas considerably and improve performance.
Function syntax: LET(name1, name_value1, calculation_or_name2, [name_value2, calculation_or_name3...])
INDEX(B3:B16,MATCH(MODE.SNGL(MATCH(B3:B16,B3:B16,0)),MATCH(B3:B16,B3:B16,0),0))
MATCH(B3:B16,B3:B16,0) is repeated twice.
x - MATCH(B3:B16,B3:B16,0)
B3:B16 is repeated three times.
y - B3:B16
LET(y,B3:B16,x,MATCH(y,y,0),INDEX(y,MATCH(MODE.SNGL(x),x,0)))
6. How to create a frequency table based on text values

What is a frequency table?
A frequency table in statistics is a method of summarizing a data set by showing how often each value or category is repeated. A frequency table usually has two or more columns: one for the values or categories of the variable, and one for the frequencies. A frequency table may also show relative frequency and cumulative frequency.
I demonstrated here: How to create a frequency table based on numerical values, this example shows a formula that creates a frequency table based on text values.
You need Excel 365 to use the following formula, it is entered as a regular formula, however, it spills values below and to the right as far as needed.
Excel 365 formula in cell D4:
This formula creates a frequency table and sorts the output by frequency from large to small. The image above shows that grade "D" is the most common and then "C","B", "E", and lastly "A".
The formula above will not work if your data is arranged across multiple columns, read the following article if that is the case:
Extract a unique distinct list across multiple columns and rows sorted based on frequency
Explaining formula in cell D4
Step 1 - Find relative position
The MATCH function returns the relative position of an item in an array that matches a specified value in a specific order.
Function syntax: MATCH(lookup_value, lookup_array, [match_type])
MATCH(B3:B16,B3:B16,0)
becomes
MATCH({"D";"E";"C";"D";"A";"E";"D";"B";"D";"C";"B";"D";"C";"B"},{"D";"E";"C";"D";"A";"E";"D";"B";"D";"C";"B";"D";"C";"B"},0)
and returns
{1;2;3;1;5;2;1;8;1;3;8;1;3;8}
Step 2 - Extract unique distinct numerical values
The UNIQUE function returns a unique or unique distinct list.
Function syntax: UNIQUE(array,[by_col],[exactly_once])
UNIQUE(MATCH(B3:B16,B3:B16,0))
becomes
UNIQUE({1;2;3;1;5;2;1;8;1;3;8;1;3;8})
and returns
{1;2;3;5;8}
Step 3 - Calculate frequency
The FREQUENCY function calculates how often values occur within a range of values and then returns a vertical array of numbers.
Function syntax: FREQUENCY(data_array, bins_array)
FREQUENCY(MATCH(B3:B16,B3:B16,0),UNIQUE(MATCH(B3:B16,B3:B16,0)))
becomes
FREQUENCY({1;2;3;1;5;2;1;8;1;3;8;1;3;8},{1;2;3;5;8})
and returns
{5;2;3;1;3;0}
Step 4 - Extract unique distinct text values
The UNIQUE function returns a unique or unique distinct list.
Function syntax: UNIQUE(array,[by_col],[exactly_once])
UNIQUE(B3:B16)
becomes
UNIQUE({"D";"E";"C";"D";"A";"E";"D";"B";"D";"C";"B";"D";"C";"B"})
and returns
{"D";"E";"C";"A";"B"}.
Step 5 - Stack arrays horizontally
The HSTACK function combines cell ranges or arrays. Joins data to the first blank cell to the right of a cell range or array (horizontal stacking)
Function syntax: HSTACK(array1,[array2],...)
HSTACK(UNIQUE(B3:B16),FREQUENCY(MATCH(B3:B16,B3:B16,0),UNIQUE(MATCH(B3:B16,B3:B16,0))))
becomes
HSTACK({"D";"E";"C";"A";"B"},{5;2;3;1;3;0})
and returns
{"D",5;"E",2;"C",3;"A",1;"B",3;#N/A,0}
Step 6 - Remove last row
The DROP function removes a given number of rows or columns from a 2D cell range or array.
Function syntax: DROP(array, rows, [columns])
DROP(HSTACK(UNIQUE(B3:B16),FREQUENCY(MATCH(B3:B16,B3:B16,0),UNIQUE(MATCH(B3:B16,B3:B16,0)))),-1)
becomes
DROP({"D",5;"E",2;"C",3;"A",1;"B",3;#N/A,0},-1)
and returns
{"D",5;"E",2;"C",3;"A",1;"B",3}.
Step 7 - Sort array by the frequency
The SORT function sorts values from a cell range or array
Function syntax: SORT(array,[sort_index],[sort_order],[by_col])
SORT(DROP(HSTACK(UNIQUE(B3:B16),FREQUENCY(MATCH(B3:B16,B3:B16,0),UNIQUE(MATCH(B3:B16,B3:B16,0)))),-1),2,-1)
becomes
SORT({"D",5;"E",2;"C",3;"A",1;"B",3})
and returns
{"D",5;"C",3;"B",3;"E",2;"A",1}.
Step 8 - Shorten formula
The LET function lets you name intermediate calculation results which can shorten formulas considerably and improve performance.
Function syntax: LET(name1, name_value1, calculation_or_name2, [name_value2, calculation_or_name3...])
SORT(DROP(HSTACK(UNIQUE(B3:B16),FREQUENCY(MATCH(B3:B16,B3:B16,0),UNIQUE(MATCH(B3:B16,B3:B16,0)))),-1),2,-1)
MATCH(B3:B16,B3:B16,0) is repeated twice.
x - MATCH(B3:B16,B3:B16,0)
B3:B16 is repeated three times.
y- B3:B16
LET(y,B3:B16,x,MATCH(y,y,0),SORT(DROP(HSTACK(UNIQUE(y),FREQUENCY(x,UNIQUE(x))),-1),2,-1))
Useful links
I have more about the mode or modal in statistics written here:
- What is the mode or modal in statistics?
- Why calculate the most frequent value (mode or modal)?
- How can you interpret the mode in relation to the mean and median?
- What is the difference between the MODE.SNGL, MODE.MULT, and the MODE functions?
MODE.SNGL function - Microsoft
Mode: What It Is in Statistics and How to Calculate It
Mode (statistics) - wikipedia
'MODE.SNGL' function examples
The following article has a formula that contains the MODE.SNGL function.
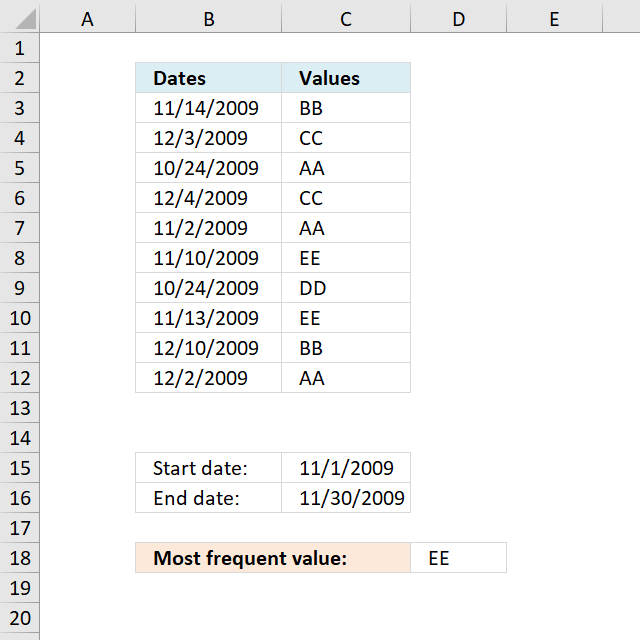
I will in this article show you how to extract the most frequent value (text or number) between two dates […]
Functions in 'Statistical' category
The MODE.SNGL function function is one of 73 functions in the 'Statistical' category.
How to comment
How to add a formula to your comment
<code>Insert your formula here.</code>
Convert less than and larger than signs
Use html character entities instead of less than and larger than signs.
< becomes < and > becomes >
How to add VBA code to your comment
[vb 1="vbnet" language=","]
Put your VBA code here.
[/vb]
How to add a picture to your comment:
Upload picture to postimage.org or imgur
Paste image link to your comment.
Contact Oscar
You can contact me through this contact form