'Column chart' category
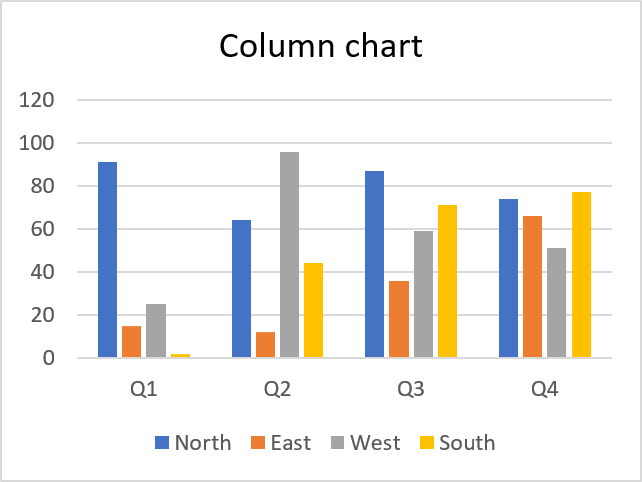

You are here: Excel » Charts » Column chart »

How to create a column chart
The clustered column chart allows you to graph data in vertical bars, this layout makes it easy to compare values […]
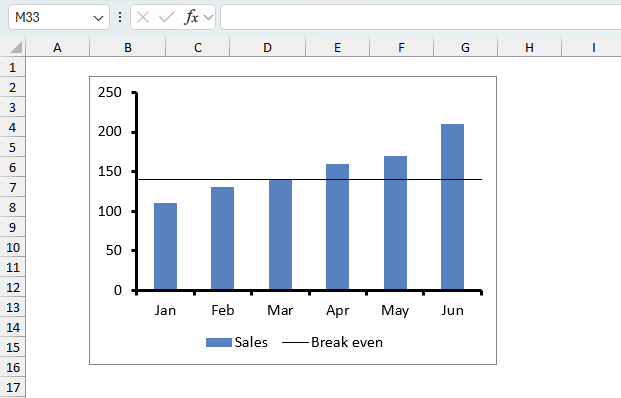
How to add horizontal line to chart
This tutorial shows you how to add a horizontal/vertical line to a chart. Excel allows you to combine two types […]
Highlight a column in a stacked column chart
This interactive chart allows you to select a country by press with left mouse button oning on a spin button. […]
How to replace columns with pictures in a column chart
I found an interesting chart on CNN's website: Rise of the supersize rugby player It shows the average height of athletes […]
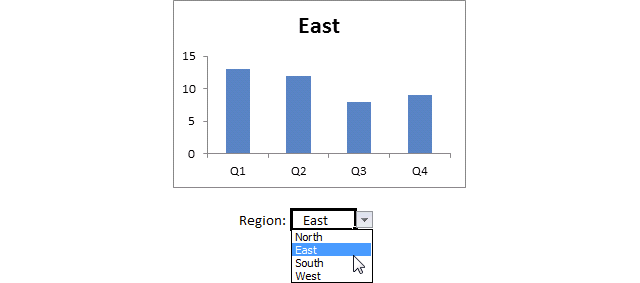
How to animate an Excel chart
This article demonstrates how to create a chart that animates the columns when filtering chart data. The columns change incrementally […]
Color chart columns based on cell color
This article demonstrates macros that automatically changes the chart bar colors based on the corresponding cell, the first example is […]

Excel categories


Latest updated articles.
More than 300 Excel functions with detailed information including syntax, arguments, return values, and examples for most of the functions used in Excel formulas.
More than 1300 formulas organized in subcategories.
Excel Tables simplifies your work with data, adding or removing data, filtering, totals, sorting, enhance readability using cell formatting, cell references, formulas, and more.
Allows you to filter data based on selected value , a given text, or other criteria. It also lets you filter existing data or move filtered values to a new location.
Lets you control what a user can type into a cell. It allows you to specifiy conditions and show a custom message if entered data is not valid.
Lets the user work more efficiently by showing a list that the user can select a value from. This lets you control what is shown in the list and is faster than typing into a cell.
Lets you name one or more cells, this makes it easier to find cells using the Name box, read and understand formulas containing names instead of cell references.
The Excel Solver is a free add-in that uses objective cells, constraints based on formulas on a worksheet to perform what-if analysis and other decision problems like permutations and combinations.
An Excel feature that lets you visualize data in a graph.
Format cells or cell values based a condition or criteria, there a multiple built-in Conditional Formatting tools you can use or use a custom-made conditional formatting formula.
Lets you quickly summarize vast amounts of data in a very user-friendly way. This powerful Excel feature lets you then analyze, organize and categorize important data efficiently.
VBA stands for Visual Basic for Applications and is a computer programming language developed by Microsoft, it allows you to automate time-consuming tasks and create custom functions.
A program or subroutine built in VBA that anyone can create. Use the macro-recorder to quickly create your own VBA macros.
UDF stands for User Defined Functions and is custom built functions anyone can create.
A list of all published articles.