'Custom charts' category
Advanced Excel Chart Techniques
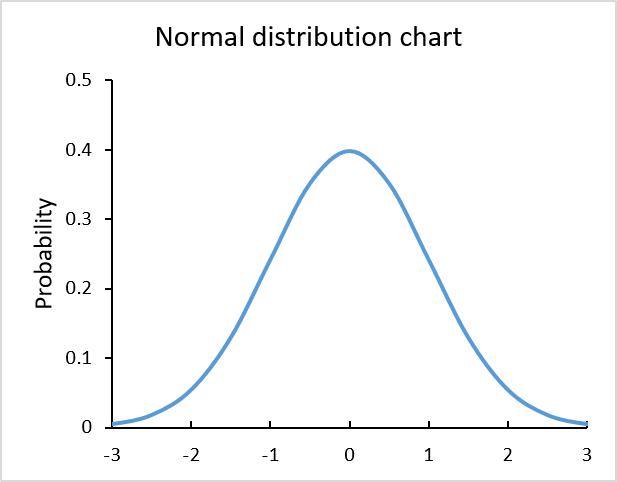
Table of Contents How to graph a normal distribution How to build an arrow chart How to graph an equation […]
Table of Contents How to graph a normal distribution How to build an arrow chart How to graph an equation […]
Excel formula categories
AverageChooseCombine MergeCompareConcatenateConditional FormattingCountCount valuesDatesDuplicatesExtractFilterFilter recordsFiltered valuesFilterxmlHyperlinkIf cellIndex MatchLogicLookupsMatchMaxMinNumbers in sumOR logicOverlappingPartial matchRecordsSequenceSmallSort bySort valuesSumSumifsSumproductString manipulationTimeUnique distinct recordsUnique distinct valuesUnique recordsUnique valuesVlookupVlookup return values