'Highlight' category
Highlight a data series in a chart
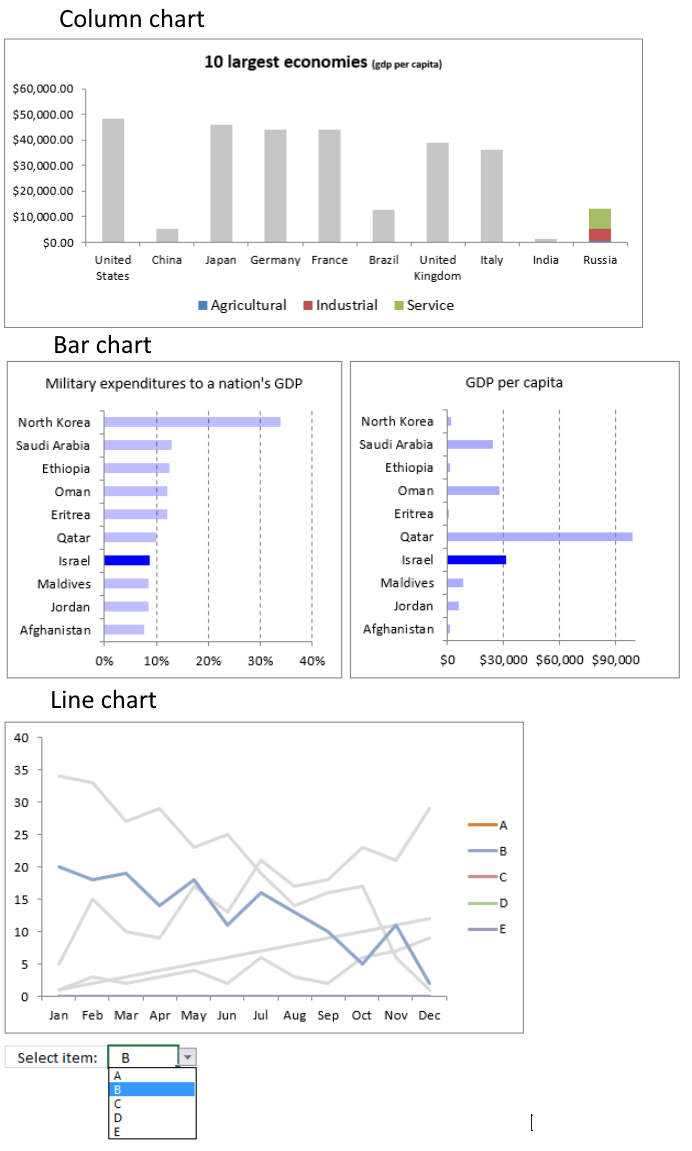
This article demonstrates how to highlight a bar, group of bars, a line, and a column in their charts respectively. […]
This article demonstrates how to highlight a bar, group of bars, a line, and a column in their charts respectively. […]